This is the first in a two-part series of reports on the U.S. fixed broadband experience. This first report focuses on the most ubiquitous national Internet brands, and the overall experience of their users — looking at five key measures of the broadband user experience: Download Speed, Upload Speed, Consistent Quality, Video Experience and Reliability Experience. In June, we'll take a more granular look at the experience of customers of the major operators in each of the 50 largest Metropolitan Statistical Areas.
We include the five Internet Service Providers (ISPs) in the U.S. with the most extensive service areas: AT&T, Spectrum (Charter)*, T-Mobile, Verizon, and Xfinity (Comcast). These providers are the only ones with a claim to having a near-national footprint, with each passing more than a third of U.S. homes — as per Opensignal’s Q1 2025 service territories, which leverage our proprietary network data and the latest data from the FCC. Given the focus on national brands, all award tables are technology-agnostic and include a blend of different types of ISP technology access (cable, DSL, FWA, and fiber).
*Charter results do not include Cox data.
We also conduct five head-to-head comparisons between the analyzed ISPs by looking at how each broadband provider compares against its direct competitors based on the extent of the overlap of each provider’s service area. Overlaps are based on Q1 2025 Opensignal service territories.
Note: This report was updated post-publication on October 21st 2025 to include Live Video Experience.
Key findings:
- Spectrum is top for three out of five metrics. Spectrum keeps hold of its wins for Reliability Experience and Download Speed from the previous USA Fixed Broadband reports. Additionally, Spectrum joins Xfinity on the winners’ podium for Video Experience.
- Our U.S. broadband users now have the most consistent experience on Verizon’s network. Verizon has moved into first place for Consistent Quality, scoring 83%.
- AT&T remains a national winner for Upload Speed. Our AT&T users observe average upload speeds in the triple digits, 30% faster than the next fastest ISP, Verizon.
- Xfinity and Spectrum win almost all of their head-to-head matchups. The two cablecos achieve a clean sweep for Download Speed, Video Experience and Reliability Experience. Additionally, Spectrum earns a clean sweep for Consistent Quality.
- Out of the telcos — AT&T, T-Mobile and Verizon — Verizon performs best head-to-head. Verizon wins nine of its 10 direct comparisons with AT&T and T-Mobile, conceding Upload Speed to AT&T.
National broadband experience
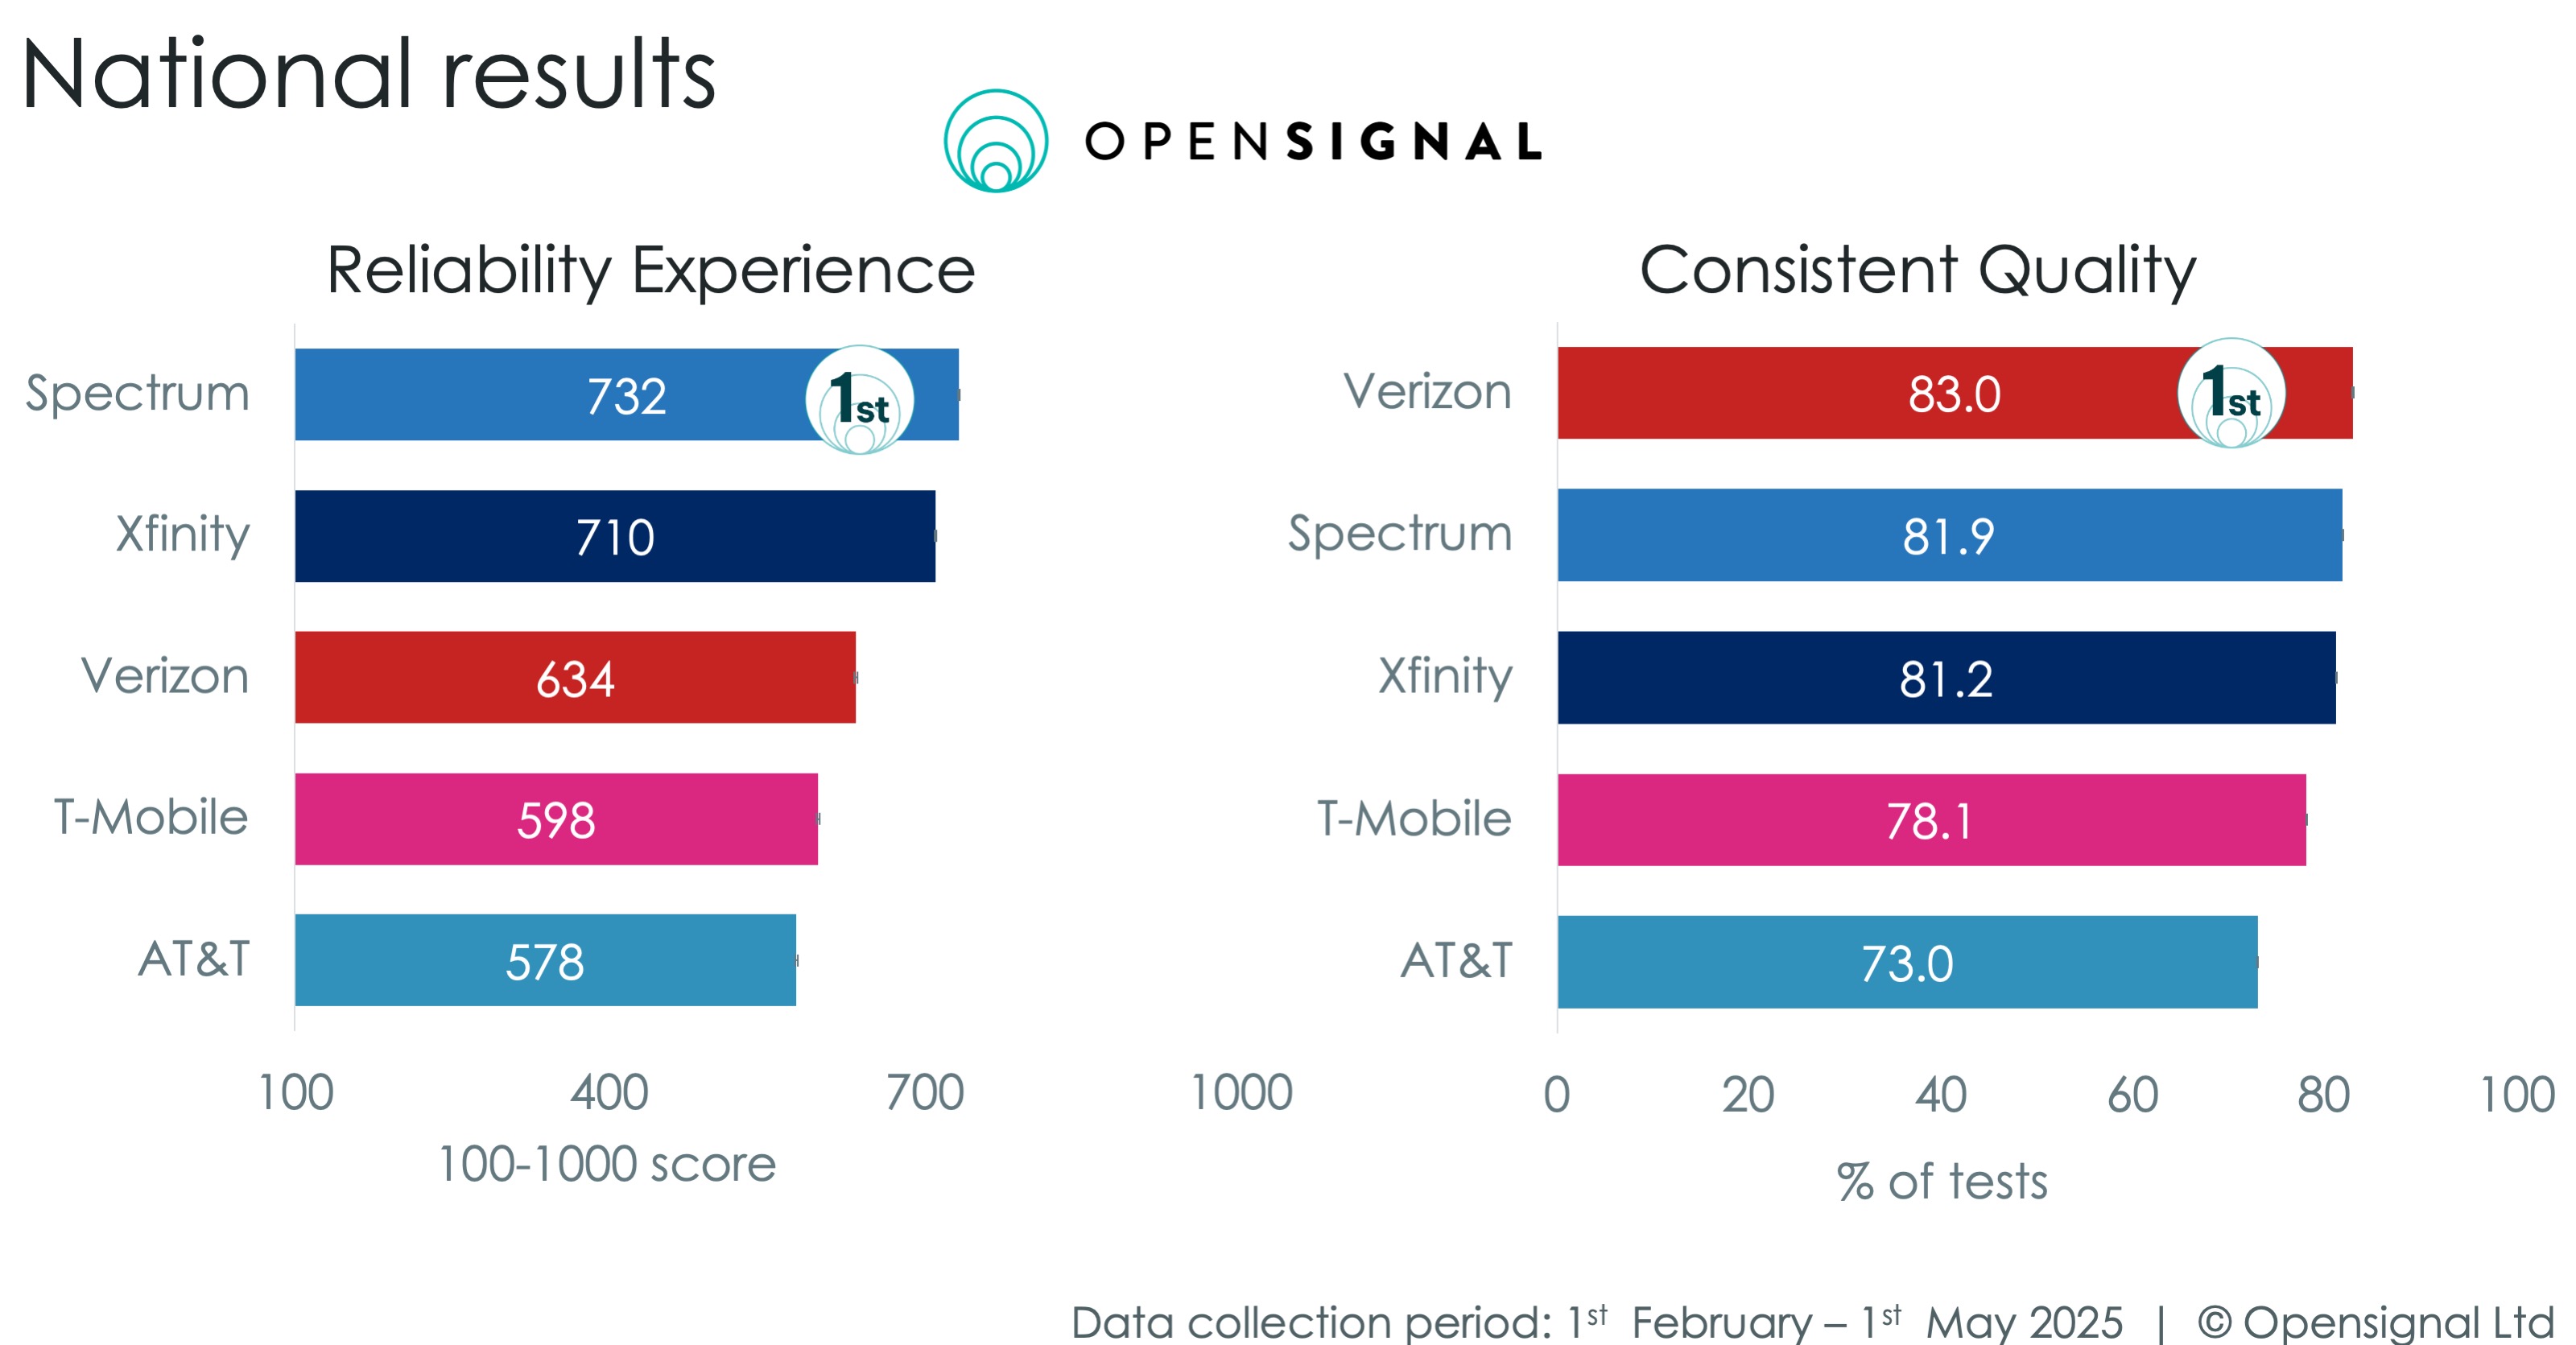
Spectrum again leads the leaderboard for Reliability Experience, 22 points above second-placed Xfinity on a 100-1000 scale. There is a sizable gap in score between the cablecos and the telcos. In a change from the previous report, T-Mobile is now ahead of AT&T for Reliability Experience. T-Mobile’s score has increased by an impressive 73 points, demonstrating improvements in its fixed wireless network performance.
Consistent Quality — Opensignal’s measure of how often users’ experience on a network is sufficient to support common applications’ requirements such as watching HD videos, participating in group video conference calls, or playing games — has had a slight change in rankings in this report. Verizon is now in the lead, followed by Spectrum. Xfinity, which was the outright winner in the last report, now places third.
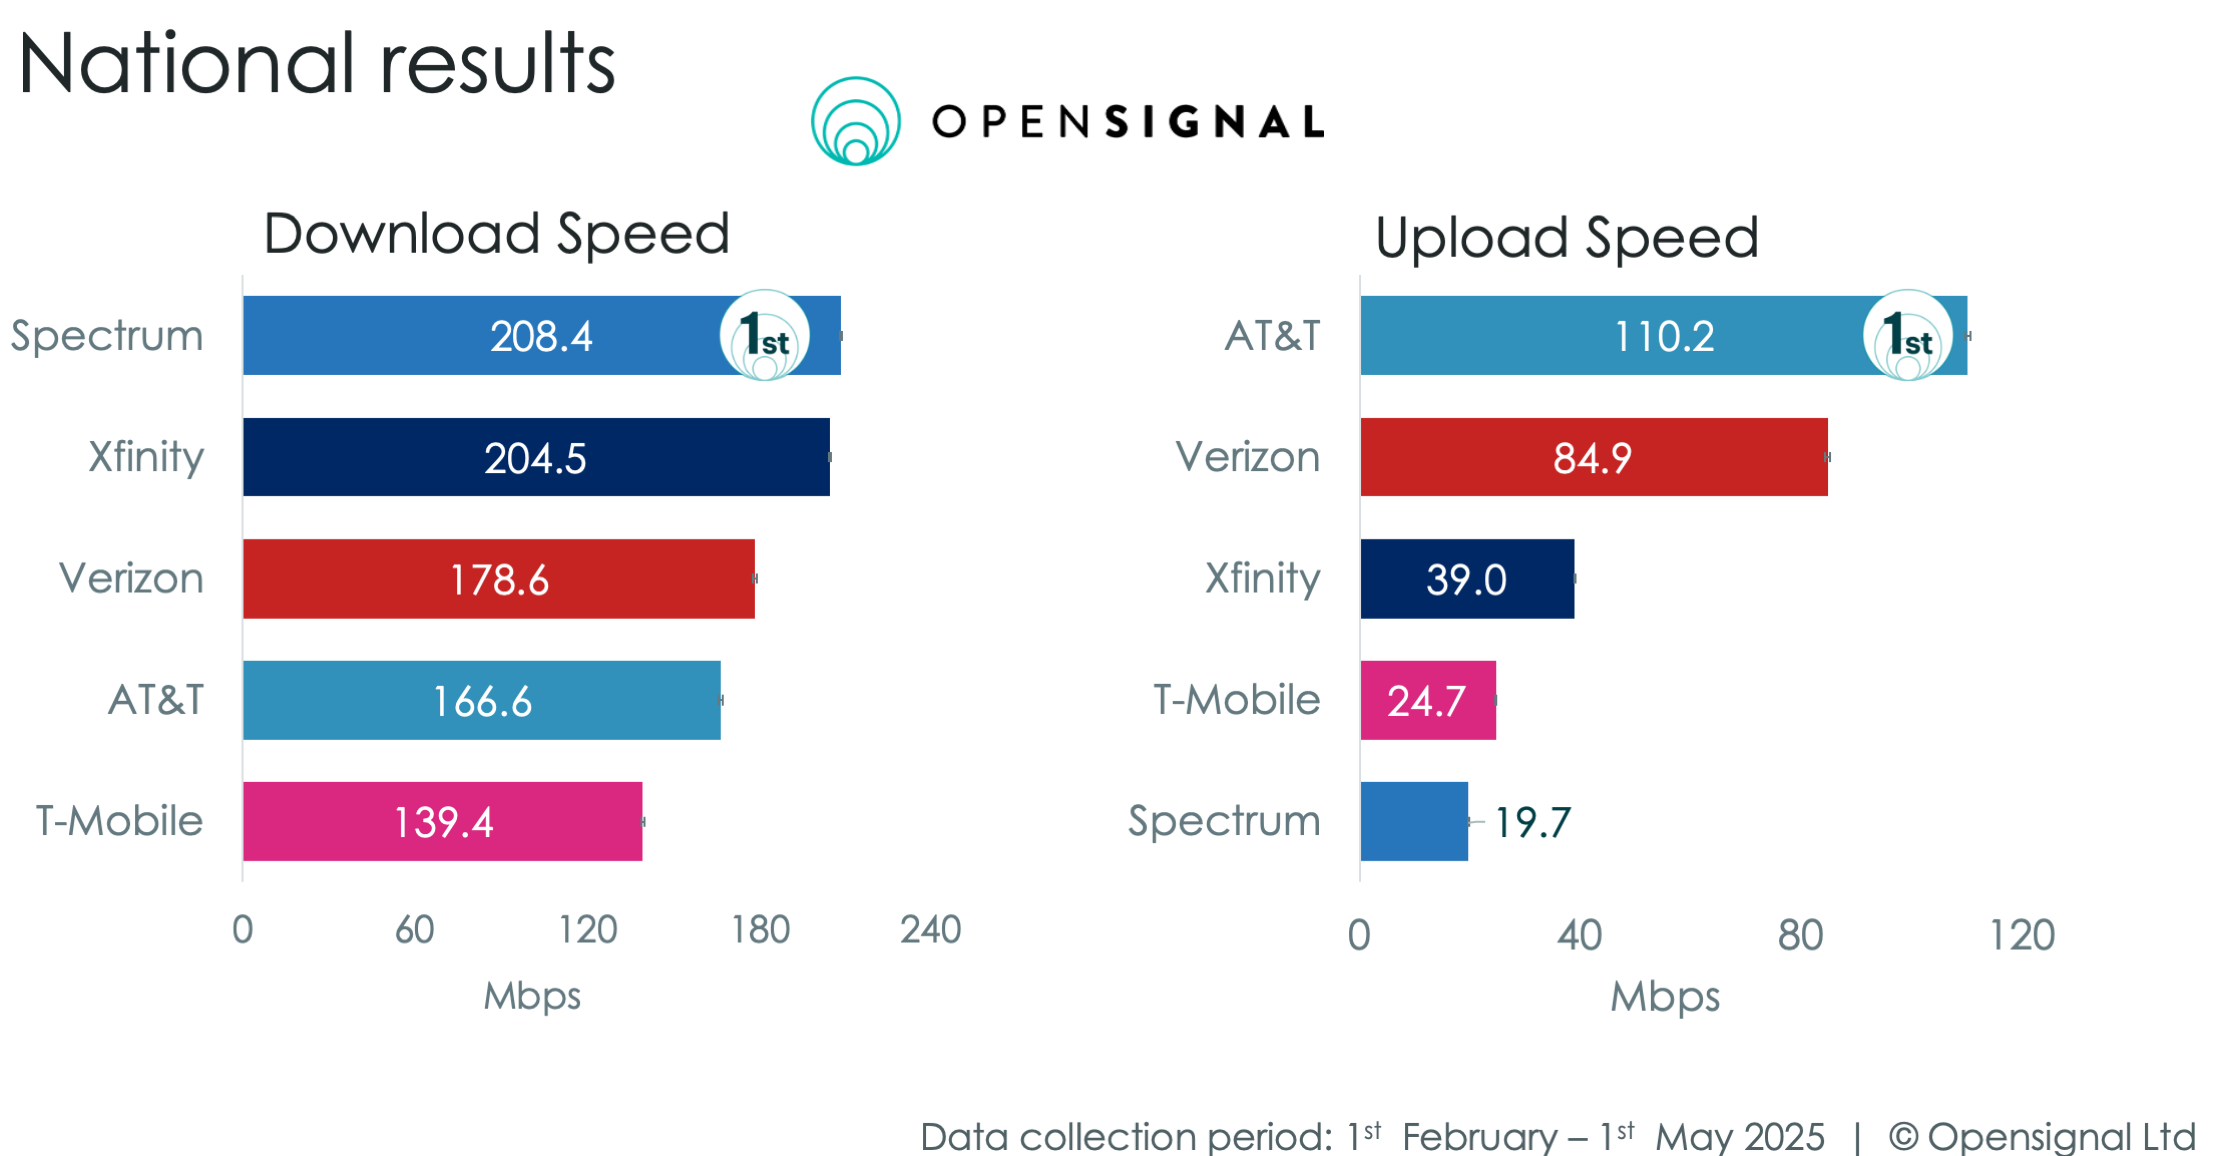
Download Speed and Upload Speed rankings are unchanged since the previous report. Cable providers Xfinity and Spectrum remain on top for Download Speed, with Spectrum slightly ahead of Xfinity — both achieving average speeds of more than 200Mbps. All five providers have seen large increases in score between reports, ranging from 23% for Spectrum to 40% for T-Mobile. AT&T remains in the lead for Upload Speed, its score bolstered by its high proportion of users subscribed to symmetrical fiber packages.

Spectrum has closed the gap for Video Experience, now statistically tying for first place with Xfinity. The range in scores between the five providers is slim, with all five placing in the Very Good (68-78) category, which means that our users on all of the analyzed ISPs are, on average, able to stream video at 1080p or better with satisfactory loading times and little stalling.
For Live Video Experience, Spectrum is the sole winner with a score of 70.5. As with Video Experience, all the scores are closely packed, with just 3.5 points separating first and fifth place. Opensignal's Live Video Experience quantifies users' perception of the quality of live video stream over large screen devices (e.g. smart TVs, tablets, laptops) on a 0-100 Mean Opinion Score scale. The metric extends the existing International Telecommunication Union (ITU) approach used for Opensignal's on-demand Video Experience metric, built upon detailed studies which have derived a relationship between technical parameters, including live playback offset, picture quality, video loading time and stall rate, with the perceived live video experience as reported by real people.
Head-to-head competitive experience
Broadband providers operate in specific geographic areas, limiting consumer choice in any given location. To reflect this, Opensignal compares broadband network experience only in regions where two providers both offer service.
In this section, each table looks at how each broadband provider fares against its key competitors. The winner between the analyzed broadband provider in each chart (named at the top of each table) and the competitor (named in each row on the left of the table) is displayed by the ISP name and brand color, denoting which ISP’s score is significantly higher in areas where the competitor’s service territories overlap. As with the national broadband experience, these award tables are technology-agnostic and include a blend of different types of ISP technology access (cable, DSL, FWA, and fiber).
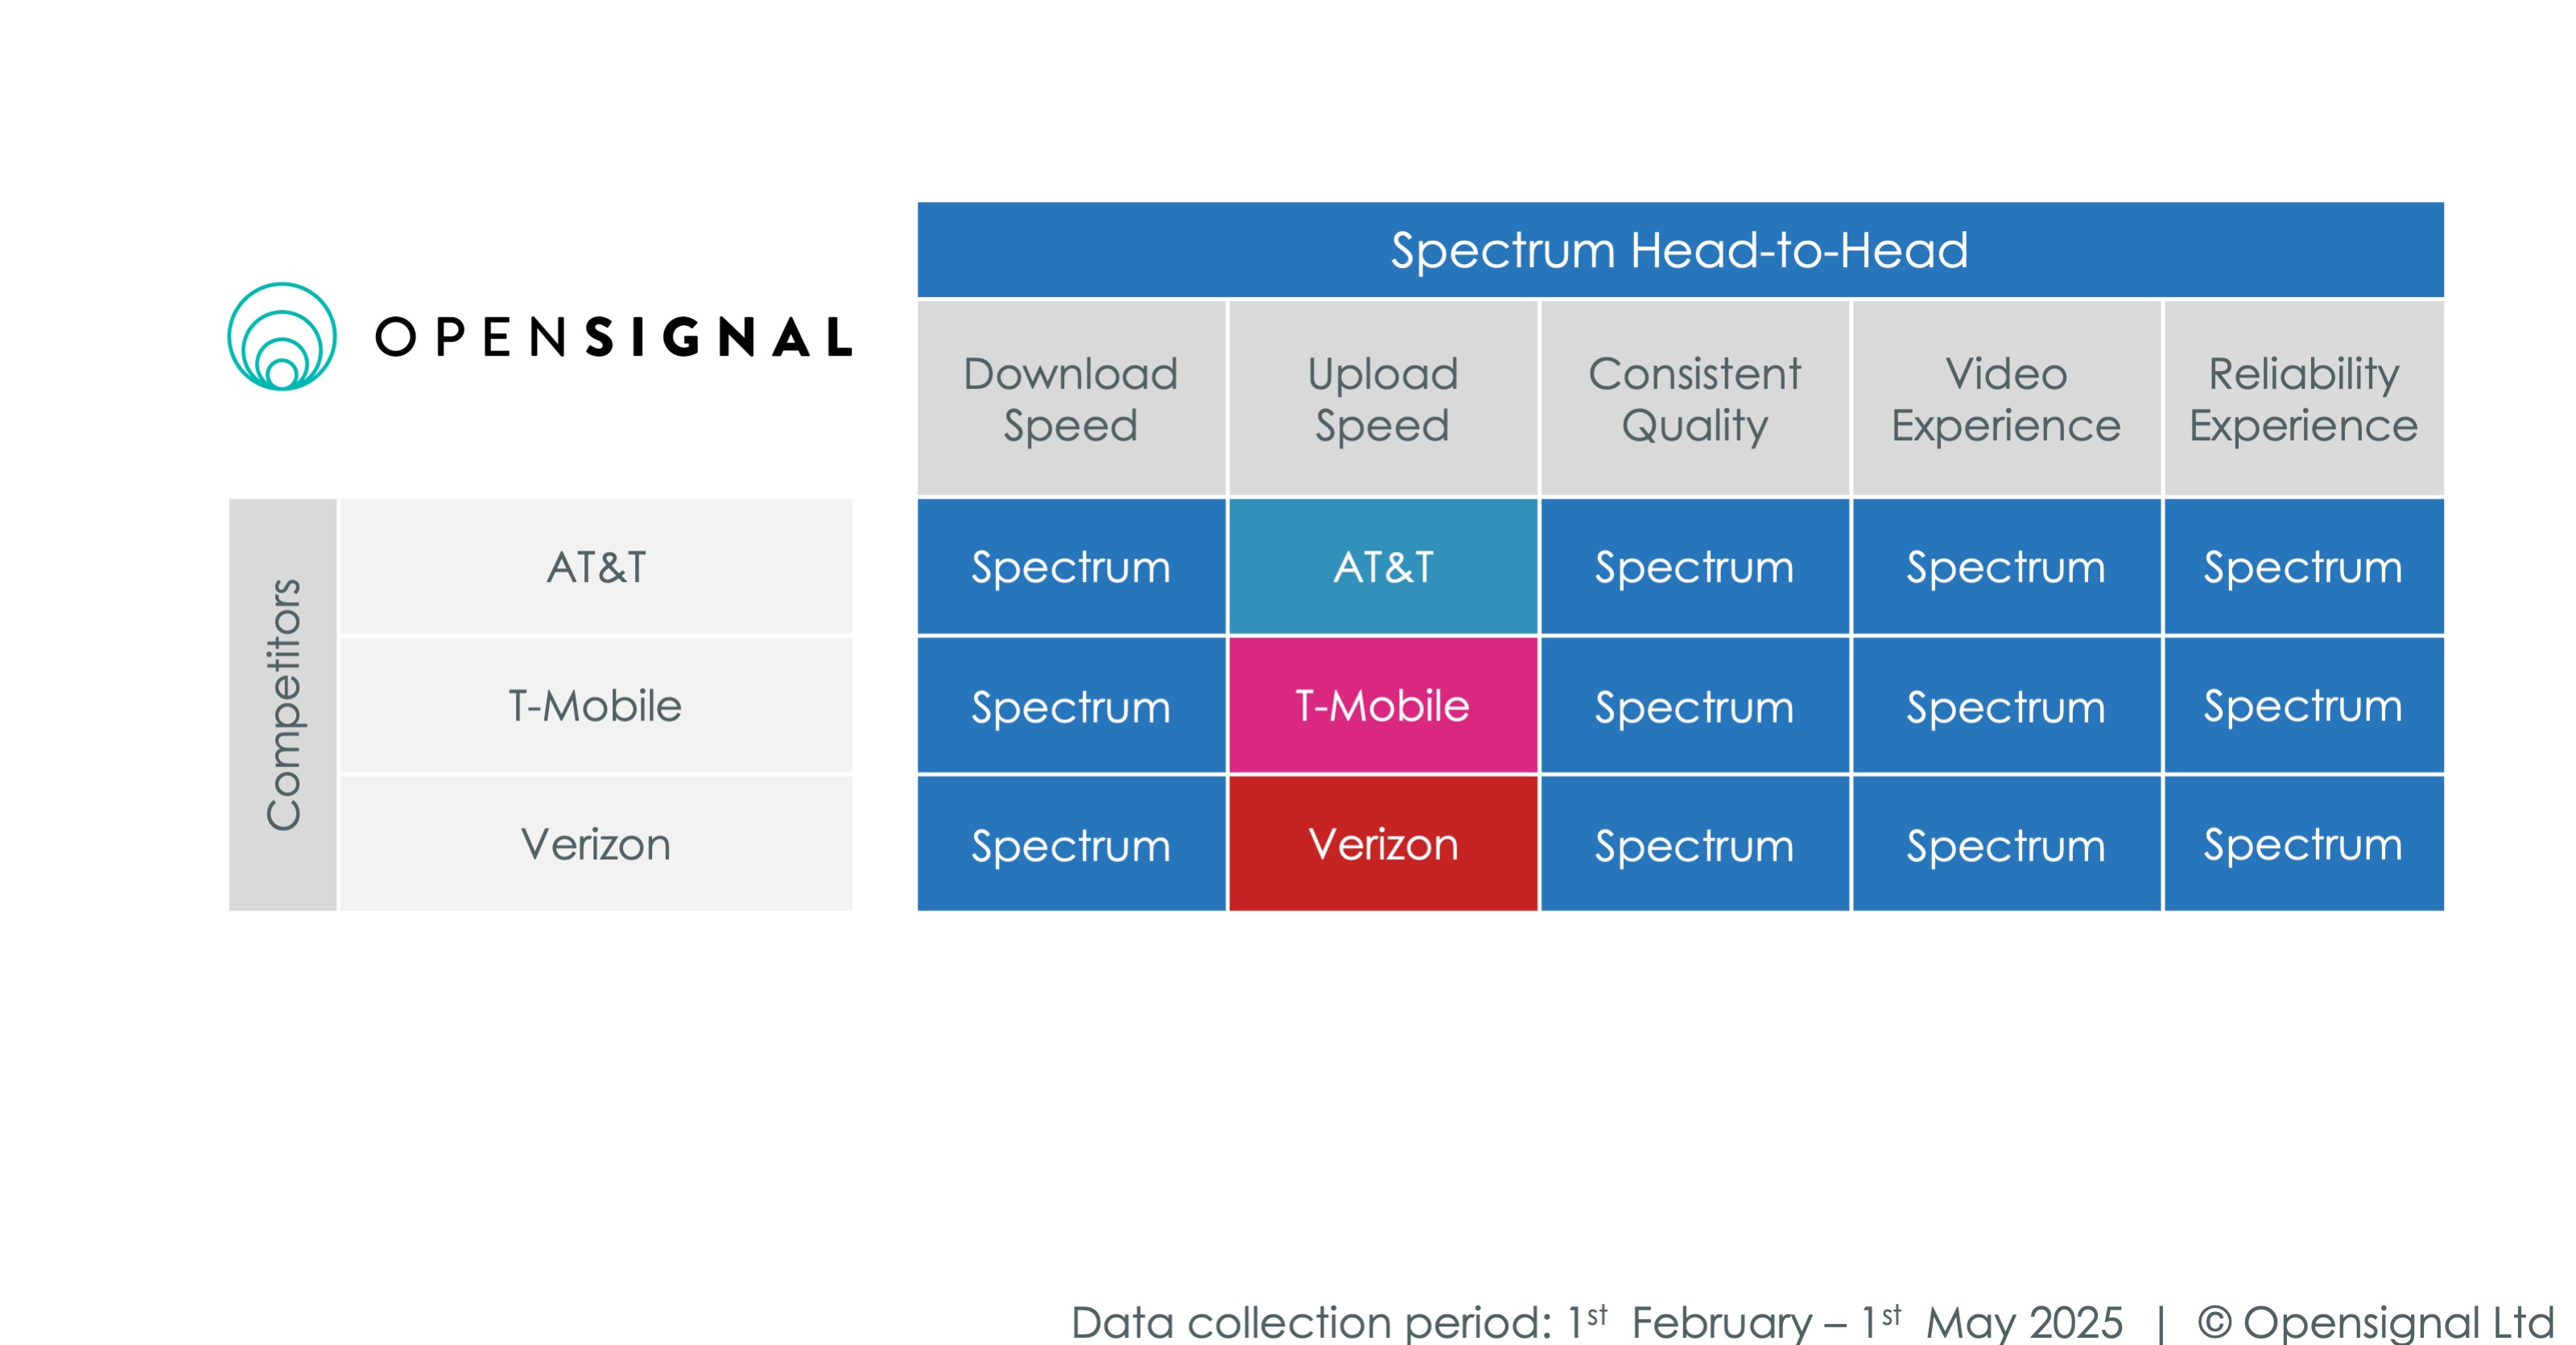
Spectrum performs well against the telcos — AT&T, T-Mobile and Verizon — in the areas where both offer services. Spectrum achieves a clean sweep in four of the five metrics, coming out on top for Download Speed, Consistent Quality, Video Experience and Reliability Experience. Competitors win on Upload Speed, as symmetrical speed capabilities are not yet common among cablecos.

Xfinity has increased its tally of head-to-head wins from the previous report — not only does Xfinity beat the competition for Reliability Experience, it breaks out of a statistical tie with T-Mobile for Upload Speed, winning all match-ups with T-Mobile outright this time around. Xfinity continues to win all three of its Download Speed comparisons, and only loses out on Consistent Quality to Verizon due to the significant overlap with Verizon FiOS.
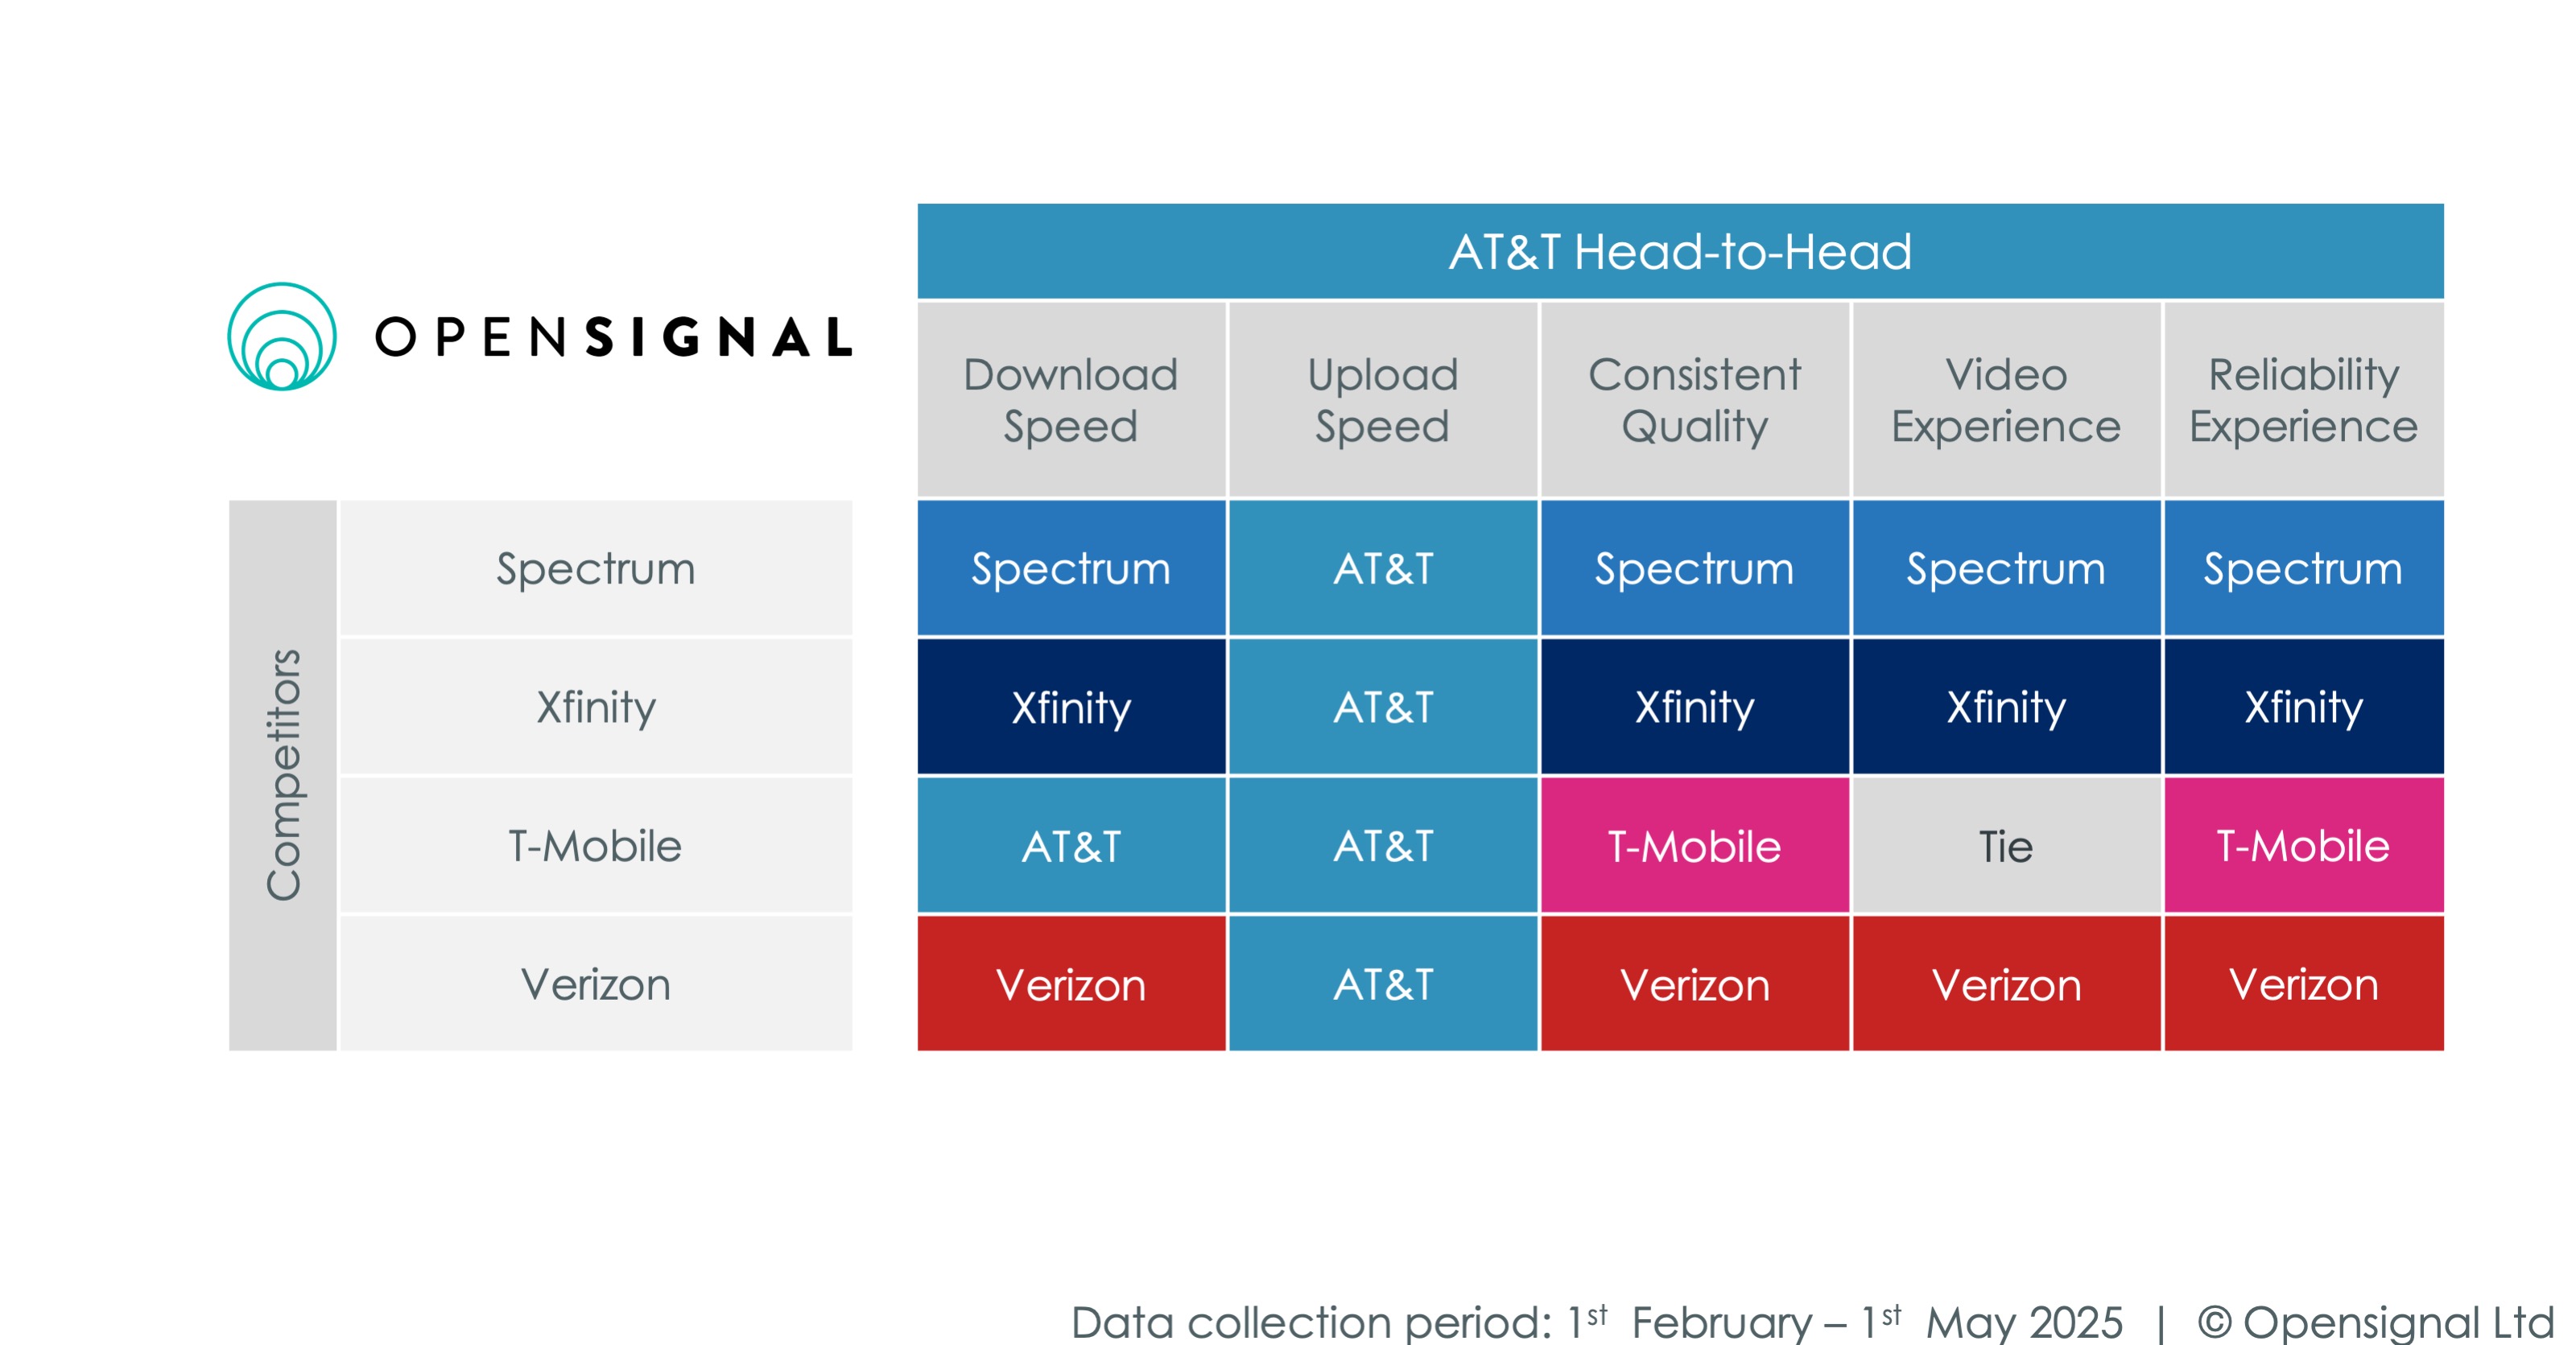
Aside from now tying with T-Mobile for Video Experience and the addition of Reliability Experience to the table, AT&T’s head-to-head table is unchanged from the last report. AT&T once again is unmatched for Upload Speed, winning against all four of its peers. AT&T’s dominance for Upload Speed is due to its symmetrical fiber product, which makes up more than two-thirds of its broadband connections — proportionally more than in the last report. Additionally, from Q1 2024 to Q1 2025 AT&T’s fixed wireless customer base has quadrupled to more than 800,000 subscribers.

T-Mobile manages a few victories in its head-to-head comparisons. It is recognized for Upload Speed against Spectrum, and Consistent Quality and Reliability Experience against AT&T — additionally, T-Mobile statistically ties with AT&T for Video Experience. Although T-Mobile is in the beginning stages of its T-Fiber program, the vast majority of its broadband network is fixed wireless access (FWA). While 5G FWA is often outperformed by traditional wireline offerings, its lower price point makes it an attractive prospect for many users, with 5G FWA absorbing all U.S. broadband subscriber growth since mid-2022. T-Mobile leads the industry in subscriber count, gaining 1.7 million net additions since Q1 2024, up to 6.9 million.

Verizon performs well against both other telcos — AT&T and T-Mobile — only conceding Upload Speed to AT&T out of all match-ups. In both cases, the overlap is overwhelmingly with competitors’ fixed wireless footprint, not their wireline footprint. Compared to the cablecos — Xfinity and Spectrum — Verizon comes out on top for Upload Speed, due to its large proportion of fiber subscribers. Since the previous report, Verizon had 150,000 fiber net additions, up to 7.2 million, while DSL subscriptions reduced to 150,000 total connections. However, the largest change was in fixed wireless access figures, with Verizon’s customer base increasing by 800,000 connections, to almost 3 million subscribers.
Methodology and definitions:
Opensignal references consumer-facing brand names in the reports, however, it is important to note that the ownership and operation of broadband infrastructure may be attributed to different corporate entities. We have included a table below that outlines the parent infrastructure companies associated with the consumer-facing broadband provider names.
Plan characteristics — for example, speed tiers or data caps — vary greatly by provider and the dispersion of the plan mix will affect the average experience result. Opensignal’s measurements capture users’ experience, regardless of the plan that they have purchased from their provider. This report analyzes the real-world situation across all users’ plans.
Opensignal also captures user measurements across all broadband network architectures, encompassing fiber (FTTx), xDSL, cable, fixed wireless access (FWA) via 4G and 5G, as well as satellite, and reports on a holistic evaluation of our users’ experience with the listed providers' internet services.
Download Speed
Measured in Mbps, Download Speed represents the typical everyday speeds a user experiences across a provider’s network.
Upload Speed
Measured in Mbps, Upload Speed measures the average upload speeds for each internet service provider observed by our users across their fixed networks. Typically, upload speeds are slower than download speeds, but this often depends on the technology used for broadband connections.
Consistent Quality
Measures how often users’ experience on a network was sufficient to support common applications’ requirements. Consistent Quality uses six key performance indicators, including download and upload speed, latency, jitter, packet loss and time to first byte. Metrics are represented as a percentage of users’ tests that have met the minimum recommended performance thresholds to watch HD video, complete group video conference calls and play games. Consistent quality is measured across all users at all hours of the day.
Video Experience
Opensignal’s adaptive video experience quantifies video quality streamed to mobile devices by measuring real-world video streams over an operator's network. The metric measures users’ adaptive video experience using a Mean Opinion Score (MOS) approach inspired by International Telecommunication Union (ITU) studies which have derived a relationship between technical parameters of adaptive bitrate video streaming and the perceived video experience as reported by real people.
The videos tested are streamed directly from the world’s largest video content providers and include a wide selection of resolutions that dynamically match the network conditions, available bandwidth, and device performance. Resolutions range from 144p to 2160p, which is also called 4K or UHD (Ultra High Definition). The model calculates a MOS score on a 0 to 100 scale by evaluating several parameters, including the time to start playing the video, the quality of the video, the time playing each resolution, and the time spent re-buffering.
Live Video Experience
Opensignal's Live Video Experience quantifies users' perception of the quality of live video stream over large screen devices (e.g. smart TVs, tablets, laptops) on a 0-100 Mean Opinion Score scale. The metric extends the existing International Telecommunication Union (ITU) approach used for Opensignal's on-demand Video Experience metric, built upon detailed studies which have derived a relationship between technical parameters, including live playback offset, picture quality, video loading time and stall rate, with the perceived live video experience as reported by real people.
Reliability Experience
Opensignal’s Broadband Reliability Experience metric measures the entire user experience, from establishing a connection to successfully completing tasks like streaming video, browsing the web, and scrolling through social media. It captures the true end-to-end reliability experience by analyzing the two most popular internet protocols - TCP (transmission control protocol) and UDP (user datagram protocol) - for a comprehensive measure of every aspect of households' experience with their ISP’s network. We can assess when things are working flawlessly, when something is erratic, and when there is no connection at all. Calculated on a scale of 100-1000, with higher scores indicating better Reliability Experience, the metric consists of three main components:
- Connectivity: Measuring the household's ability to connect to the internet. While ISPs strive to provide ubiquitous connectivity there are often events that lead to outages, and the connectivity component of the score captures the proportion of times when households don’t have internet access.
- Completion: Completion measures the ability to complete typical tasks. It ensures that the established connection is maintained and there is a consistent flow of information as consumers would expect.
- Sufficiency: Ensures that the task is performed sufficiently well. This component includes speed thresholds, latency thresholds, jitter, and other technical components that are prerequisites for good service and application experiences.
Opensignal Limited retains ownership of this insight including all intellectual property rights, data, content, graphs & analysis. Reports and insights produced by Opensignal Limited may not be quoted, reproduced, distributed, published for any commercial purpose (including use in advertisements or other promotional content) without prior written consent. Journalists are encouraged to quote information included in Opensignal reports and insights provided they include clear source attribution. For more information, contact [email protected].