
USA

Fixed Broadband Experience
June 2025

Opensignal is the independent global standard for analyzing consumers' connectivity experiences. Our industry reports are the definitive guide to understanding what happens when people use their mobile and broadband connections in their daily life.

Author: Fiona Armstrong-Mills, Principal Analyst Data Collection Period: Feb 01 - May 01, 2025

USA

Fixed Broadband Experience
June 2025

Opensignal is the independent global standard for analyzing consumers' connectivity experiences. Our industry reports are the definitive guide to understanding what happens when people use their mobile and broadband connections in their daily life.

Author: Fiona Armstrong-Mills, Principal Analyst

Data Collection Period: Feb 01 - May 01, 2025

USA Fixed Broadband Experience — MSA View


Key Findings

AT&T Fiber leads in dense urban markets

AT&T’s fiber service meets the criteria for inclusion in this report for 29 of the top 50 MSAs, and in those markets it excels. Our AT&T users enjoy the fastest average download and upload speeds, and best Video Experience in all these markets, with AT&T topping the leaderboard for these rankings either outright or jointly with other ISPs. When looking at Opensignal's metrics for experience consistency, AT&T's success is slightly more limited. It wins in 21 markets apiece for Reliability Experience and Broadband Consistent Quality. This speaks to the strength of AT&T’s core network, as well as that of its ISP-issued home gateways.

Verizon FiOS shows strong results in the markets in which it operates

In the 10 MSAs where we have included Verizon FiOS, the ISP wins across every category – and almost entirely outright. The only exception is for Video Experience in Providence, Rhode Island, where it statistically ties with T-Mobile 5G Home Internet. The acquisition of Frontier will only extend this strong performance; Frontier Fiber also performs strongly in this report, sweeping victory across all five categories (jointly or outright) in three of its six MSAs, and winning for Broadband Consistent Quality in all six.

The presence of multiple fiber ISPs raises the bar for download performance

In markets where there is more than one fiber provider, the average download speeds of the top three ISPs is higher than in markets with only one fiber provider — 5Mbps faster for the top ISP, 15Mbps for the second ISP and 38Mbps faster for the third ISP. This suggests that the increased competition may be driving ISPs to offer competitive pricing on speed-tiered plans to stay competitive.

Cable ISPs are competitive on download and reliability, but fall short on upload

Despite fiber leading in most MSAs for Download Speed, in 12 MSAs cable provider subscribers experience the fastest average broadband download speeds. Cable customers also benefit from a provider with the best Reliability Experience in 20 MSAs. However, upload speeds for cable ISPs average about 35Mbps, or roughly 17% of their average download speed. Planned upgrades to DOCSIS 4.0 may well change this dynamic, but at present there are just a handful of MSAs where our users on a cable provider experience average upload speeds in excess of 50Mbps.

Fixed wireless access (FWA) does not compete on speeds, but FWA users experience comparable Broadband Consistent Quality in a handful of markets

While it's evident that FWA cannot challenge fiber on raw download or upload speed, our data shows that FWA does provide comparable broadband experience in a few markets when it comes to meeting performance thresholds for typical broadband tasks. T-Mobile and Verizon's 5G Home Internet offerings both tie with AT&T Fiber and Xfinity for Broadband Consistent Quality in San Jose, while T-Mobile jointly wins in Memphis and Verizon ties in Louisville — both again with AT&T Fiber. For Video Experience specifically, T-Mobile 5G Home Internet ties for first place in five MSAs.

Smaller providers excel in local markets

Smaller fiber ISPs — both incumbents and overbuilders — are delivering standout performance in their core markets. Smaller ILECs altafiber Fioptics and Ziply Fiber win four awards apiece in each of the markets they are present in (Cincinnati for altafiber Fioptics and both Portland and Seattle for Ziply Fiber). Overbuilders, which more directly compete with bigger ILECs, also show strong results: Sonic tops the leaderboard, either jointly or outright, for all five metrics in San Francisco; GoNetspeed wins for Upload Speed Experience, Video Experience and Reliability Experience in Hartford; and Google Fiber picks up two wins in Austin, three in both San Antonio and Kansas City, and four in Raleigh.

Market Overview

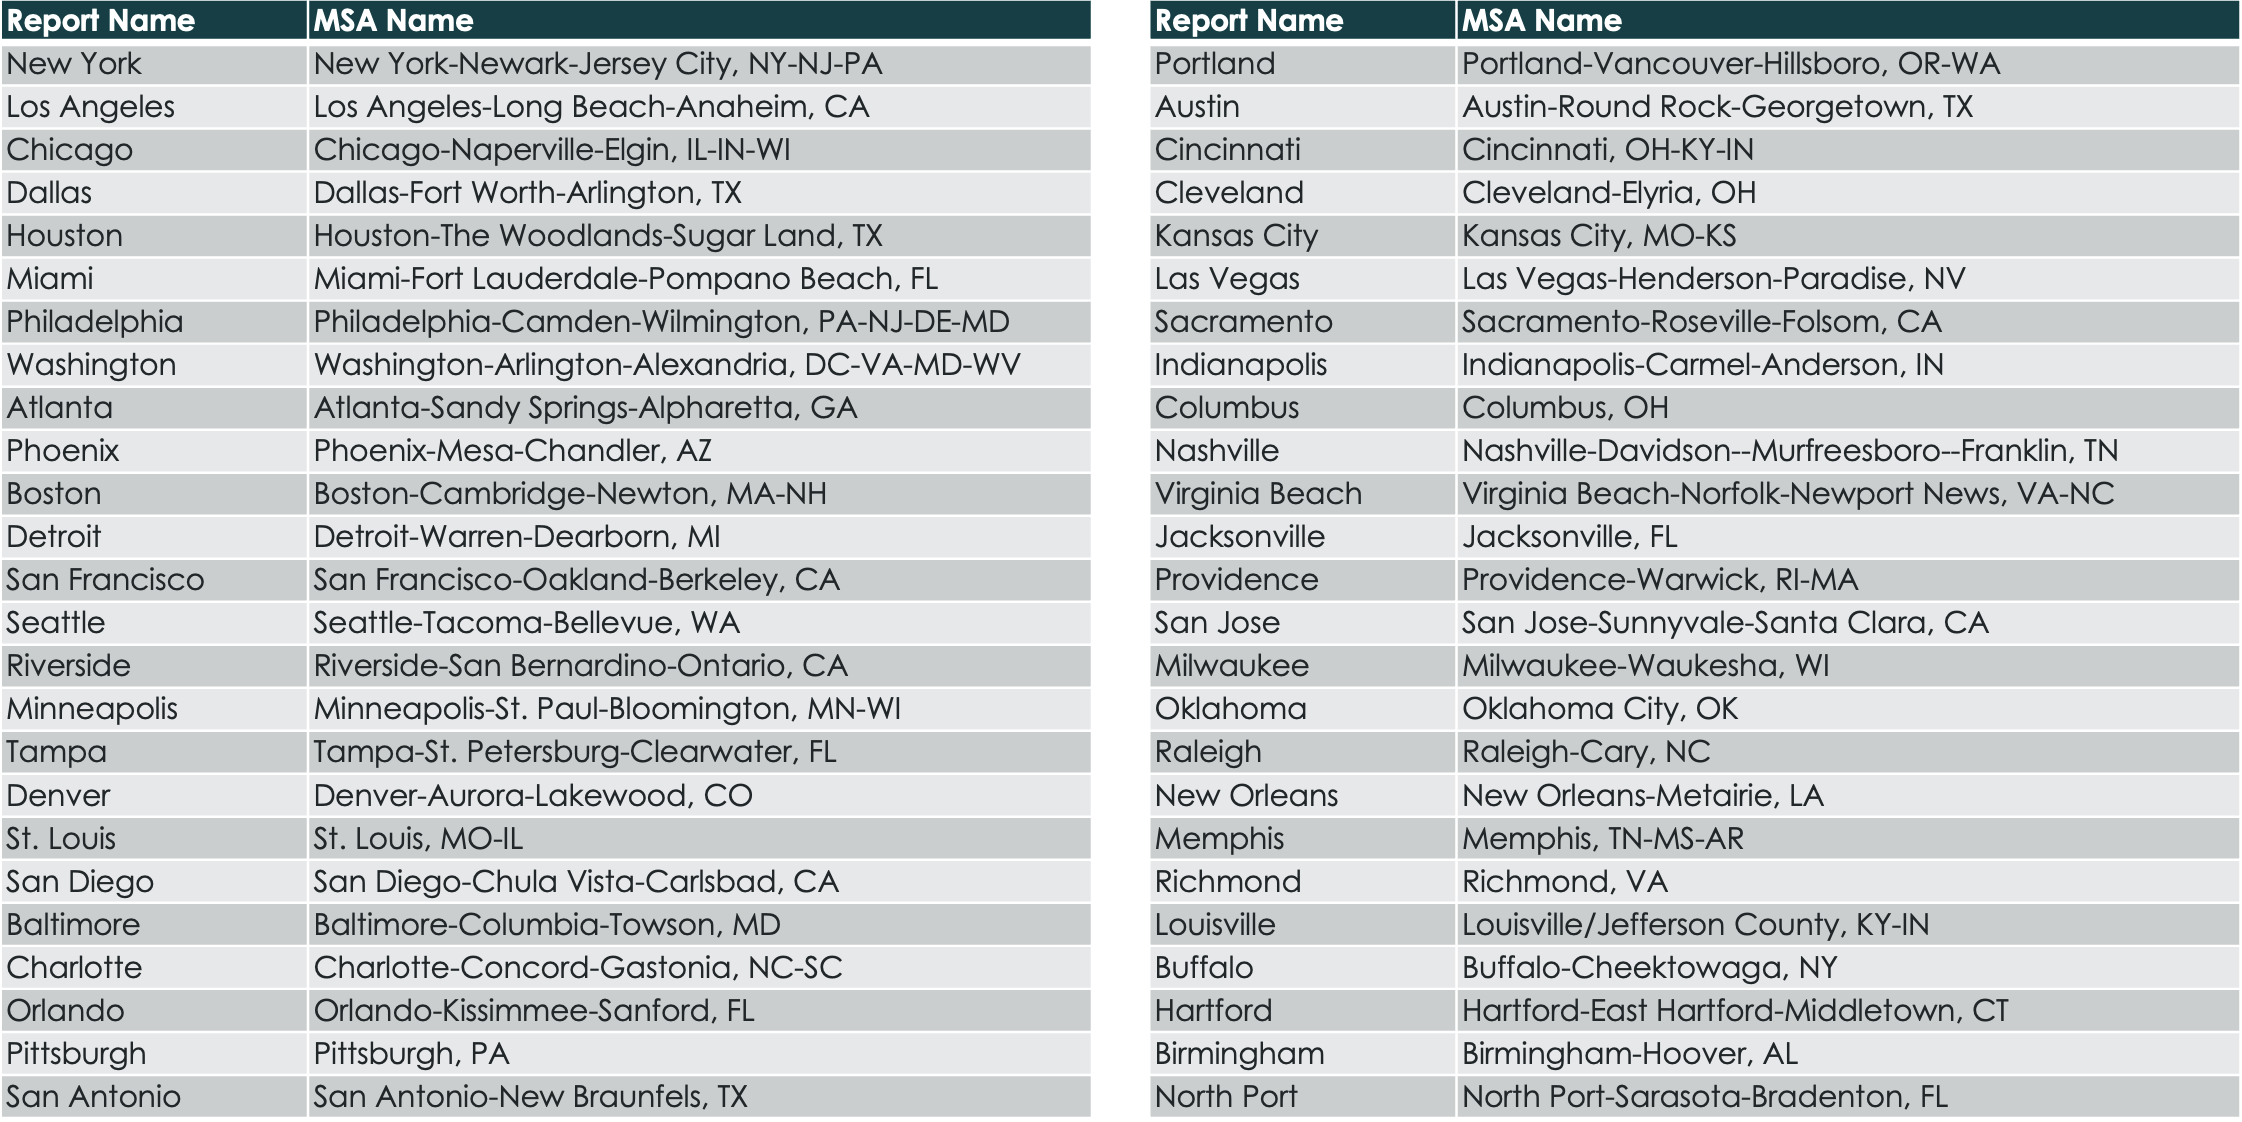
In this report, the second of a two-part series on the U.S. fixed broadband experience, we break down the experience of customers on major operators in each of the 50 largest Metropolitan Statistical Areas (MSAs).

In the U.S. broadband industry, a series of major consolidations and strategic shifts loom on the horizon — AT&T’s acquisition of Lumen’s consumer fiber assets, Verizon’s planned merger with Frontier and Charter’s merger with Cox — signal a reshaping of the competitive landscape. Yet despite these impending changes, this latest look at fixed broadband performance confirms that some core themes remain firmly in place.

Where fiber is available, it continues to rank higher compared to other technologies. Across nearly every MSA examined in this report, at least one of the top-ranked ISPs for Download Speed, Upload Speed, Reliability Experience, Broadband Consistent Quality or Video Experience is a fiber provider. Whether it's national players like AT&T or Verizon, or regional providers like altafiber Fioptics and Ziply Fiber, the performance advantage of fiber to the premises (FTTP) is visible.

However, the race for fiber supremacy is far from settled. While ILECs maintain largely separate fiber footprints, competition comes from overbuilders like Google Fiber, Metronet and GoNetSpeed. Google Fiber has announced plans to enter the Las Vegas markets this year, while Bell Canada has acquired Ziply Fiber with an eye on the ‘underpenetrated’ opportunity of the US fiber market, and plans to expand its footprint to over 12 million locations by the end of 2028 – which implies Bell’s ambitions for Ziply extend beyond its incumbent telco service territory and into overbuilds of other telcos’ footprints.

As recently as this month, T-Mobile reaffirmed its ambitions in the fiber market following the acquisition of legacy ILEC Lumos, with the official launch of T-Mobile Fiber Home Internet. T-Mobile’s overbuilder ambitions will also be furthered if and when its joint venture to acquire Metronet closes as planned in 2025. The message is clear: even in fiber-strong markets, new entrants are betting on growth.

At the same time, cable ISPs are competitive in download speed and reliability in this report. Indeed, in markets like Minneapolis, we see Xfinity users experiencing average download speeds in excess of 200Mbps – beating second-placed Quantum Fiber. The challenge for cable ISPs is ensuring that upload speeds also keep pace. This can be achieved in a variety of ways; upgrading to FTTP is one, as is rolling out DOCSIS 3.1 and above. This paired together with investment into customer premises equipment (CPE) could equally challenge the fiber upload speeds seen in many MSAs in this report.

Infrastructure competition is already raising the bar. As more ISPs offer comparable service in overlapping or adjacent markets, ISPs looking to excel should keep a keen eye on how their performance compares, and what they can do to deliver the best consistent broadband experience to their subscribers.

Adding to this competition is Fixed Wireless Access (FWA), which is disrupting the regional fixed broadband landscape – particularly in terms of market share. By the end of 2024, nearly 12 million subscribers were using FWA services, with T-Mobile and Verizon leading the way. This subscriber base is expected to grow, with operator forecasts suggesting that there may be more than 20 million FWA users by 2028. While FWA providers’ award wins in this report are modest, their Consistent Quality scores and Video Experience scores approach or statistically tie those of wired competitors in a handful of markets.

FWA performance is also improving: T-Mobile's 5G Home Internet performance has improved in download speed in all 20 of the largest MSAs by at least 20Mbps and as much as 54Mbps in Atlanta and Miami since last year’s MSA deep dive. While there's still a gap between FWA and the performance Opensignal users experience on fiber operators, this does mean FWA often outperforms legacy DSL offerings. As time goes on, continued improvement in 5G network infrastructure will allow FWA to become an increasingly competitive offering in regions where fiber or high-speed cable are lacking, assuming that any growth in FWA subscribers' data consumption doesn't outstrip providers' expectations.

In this report we examine the fixed broadband experience across the 50 largest MSAs over a period of 90 days starting on February 1, 2025, and ending on May 1, 2025, to see how they fared.

Regional Fixed Broadband Experience

June 2025, USA Report
Region
Reliability Experience
Consistent Quality
Download Speed
Upload Speed
Video Experience
Winner Verizon FiOS
Winner Verizon FiOS
Winner Verizon FiOS
Winner Verizon FiOS
Winner Verizon FiOS
Joint Winners Frontier - Fiber Spectrum
Winner Frontier - Fiber
Joint Winners AT&T Fiber Frontier - Fiber
Joint Winners Astound Broadband AT&T Fiber
Winner Astound Broadband
Winner AT&T Fiber
Winner AT&T Fiber
Winner AT&T Fiber
Winner Frontier - Fiber
Winner AT&T Fiber
Winner AT&T Fiber
Joint Winners AT&T Fiber Frontier - Fiber
Winner AT&T Fiber
Winner AT&T Fiber
Winner AT&T Fiber
Winner AT&T Fiber
Winner AT&T Fiber
Winner AT&T Fiber
Winner AT&T Fiber
Winner AT&T Fiber
Winner AT&T Fiber
Winner AT&T Fiber
Winner Verizon FiOS
Winner Verizon FiOS
Winner Verizon FiOS
Winner Verizon FiOS
Winner Verizon FiOS
Winner Verizon FiOS
Winner Verizon FiOS
Winner Verizon FiOS
Winner Verizon FiOS
Winner Verizon FiOS
Winner AT&T Fiber
Joint Winners AT&T Fiber Spectrum
Winner AT&T Fiber
Winner AT&T Fiber
Winner AT&T Fiber
Winner Cox Internet
Winner Cox Internet
Winner Cox Internet
Winner Quantum Fiber
Joint Winners Cox Internet Quantum Fiber
Winner Verizon FiOS
Winner Verizon FiOS
Winner Verizon FiOS
Winner Verizon FiOS
Winner Verizon FiOS
Winner AT&T Fiber
Winner AT&T Fiber
Winner AT&T Fiber
Winner AT&T Fiber
Winner AT&T Fiber
Winner Sonic Fiber Internet
Joint Winners Astound Broadband Sonic Fiber Internet
Joint Winners AT&T Fiber Sonic Fiber Internet
Winner Ziply Fiber
Winner Ziply Fiber
Winner Xfinity
Joint Winners Quantum Fiber Ziply Fiber
Joint Winners Quantum Fiber Xfinity Ziply Fiber
Joint Winners Frontier - Fiber Spectrum
Winner Frontier - Fiber
Joint Winners Frontier - Fiber Spectrum
Winner Frontier - Fiber
Joint Winners Quantum Fiber Xfinity
Winner Xfinity
Winner Xfinity
Winner Quantum Fiber
Joint Winners Quantum Fiber T-Mobile 5G Home Internet Xfinity
Winner Spectrum
Winner Frontier - Fiber
Winner Spectrum
Joint Winners Frontier - Fiber Frontier - Non-Fiber
Winner Frontier - Fiber
Joint Winners Quantum Fiber Xfinity
Winner Xfinity
Winner Xfinity
Winner Quantum Fiber
Joint Winners Quantum Fiber Xfinity
Winner AT&T Fiber
Joint Winners AT&T Fiber Spectrum
Winner AT&T Fiber
Winner AT&T Fiber
Winner AT&T Fiber
Winner Spectrum
Joint Winners AT&T Fiber Cox Internet Spectrum
Joint Winners AT&T Fiber Spectrum
Winner AT&T Fiber
Joint Winners AT&T Fiber Cox Internet Spectrum
Winner Verizon FiOS
Winner Verizon FiOS
Winner Verizon FiOS
Winner Verizon FiOS
Winner Verizon FiOS
Joint Winners AT&T Fiber Spectrum
Winner AT&T Fiber
Winner AT&T Fiber
Winner AT&T Fiber
Winner AT&T Fiber
Joint Winners AT&T Fiber Spectrum
Winner AT&T Fiber
Winner AT&T Fiber
Joint Winners AT&T Fiber Spectrum
Winner Verizon FiOS
Winner Verizon FiOS
Winner Verizon FiOS
Winner Verizon FiOS
Winner Verizon FiOS
Winner Google Fiber
Winner Google Fiber
Winner AT&T Fiber
Winner AT&T Fiber
Joint Winners AT&T Fiber Google Fiber
Winner Ziply Fiber
Winner Ziply Fiber
Winner Xfinity
Joint Winners Quantum Fiber Ziply Fiber
Joint Winners Quantum Fiber T-Mobile 5G Home Internet Ziply Fiber
Winner Google Fiber
Winner Google Fiber
Winner AT&T Fiber
Winner AT&T Fiber
Winner AT&T Fiber
Joint Winners altafiber Fioptics Spectrum
Winner altafiber Fioptics
Winner Spectrum
Winner altafiber Fioptics
Joint Winners altafiber Fioptics Spectrum
Joint Winners AT&T Fiber Breezeline Spectrum
Joint Winners AT&T Fiber Breezeline
Winner AT&T Fiber
Winner AT&T Fiber
Joint Winners AT&T Fiber Breezeline
Winner Google Fiber
Winner Google Fiber
Winner AT&T Fiber
Winner AT&T Fiber
Joint Winners AT&T Fiber Google Fiber
Winner Cox Internet
Winner Cox Internet
Winner Cox Internet
Winner Quantum Fiber
Joint Winners Cox Internet Quantum Fiber
Joint Winners AT&T Fiber Xfinity
Winner AT&T Fiber
Winner AT&T Fiber
Winner AT&T Fiber
Joint Winners AT&T Fiber Spectrum
Winner AT&T Fiber
Winner AT&T Fiber
Winner AT&T Fiber
Joint Winners AT&T Fiber Spectrum
Winner AT&T Fiber
Winner AT&T Fiber
Winner AT&T Fiber
Joint Winners AT&T Fiber Breezeline Spectrum
Winner AT&T Fiber
Winner AT&T Fiber
Winner AT&T Fiber
Winner AT&T Fiber
Winner AT&T Fiber
Winner Verizon FiOS
Winner Verizon FiOS
Winner Verizon FiOS
Winner Verizon FiOS
Winner Verizon FiOS
Winner AT&T Fiber
Winner AT&T Fiber
Winner AT&T Fiber
Winner AT&T Fiber
Winner AT&T Fiber
Winner Verizon FiOS
Winner Verizon FiOS
Winner Verizon FiOS
Winner Verizon FiOS
Joint Winners T-Mobile 5G Home Internet Verizon FiOS
Joint Winners AT&T Fiber Xfinity
Joint Winners AT&T Fiber T-Mobile 5G Home Internet Verizon 5G Home Internet Xfinity
Joint Winners AT&T Fiber Xfinity
Winner AT&T Fiber
Joint Winners AT&T Fiber T-Mobile 5G Home Internet Xfinity
Joint Winners AT&T Fiber T-Mobile 5G Home Internet
Winner AT&T Fiber
Winner AT&T Fiber
Winner AT&T Fiber
Winner AT&T Fiber
Winner AT&T Fiber
Winner AT&T Fiber
Winner AT&T Fiber
Winner AT&T Fiber
Winner AT&T Fiber
Winner Google Fiber
Winner Google Fiber
Joint Winners AT&T Fiber Google Fiber
Winner AT&T Fiber
Joint Winners AT&T Fiber Google Fiber
Winner AT&T Fiber
Winner AT&T Fiber
Winner AT&T Fiber
Winner AT&T Fiber
Winner AT&T Fiber
Joint Winners AT&T Fiber T-Mobile 5G Home Internet
Winner AT&T Fiber
Winner AT&T Fiber
Winner AT&T Fiber
Winner Verizon FiOS
Winner Verizon FiOS
Winner Verizon FiOS
Winner Verizon FiOS
Winner Verizon FiOS
Joint Winners AT&T Fiber Spectrum T-Mobile 5G Home Internet
Joint Winners AT&T Fiber Verizon 5G Home Internet
Winner AT&T Fiber
Winner AT&T Fiber
Winner AT&T Fiber
Winner Verizon FiOS
Winner Verizon FiOS
Winner Verizon FiOS
Winner Verizon FiOS
Winner Verizon FiOS
Joint Winners Frontier - Fiber GoNetspeed
Winner Frontier - Fiber
Joint Winners Frontier - Fiber GoNetspeed
Joint Winners Cox Internet Frontier - Fiber GoNetspeed T-Mobile 5G Home Internet
Joint Winners AT&T Fiber Spectrum
Winner AT&T Fiber
Winner AT&T Fiber
Joint Winners AT&T Fiber Spectrum
Joint Winners Frontier - Fiber Spectrum
Winner Frontier - Fiber
Winner Spectrum
Winner Frontier - Fiber
Joint Winners Frontier - Fiber Spectrum
Fixed Broadband Experience | June 2025 | © Opensignal Limited
Download Image
Selected region
  • A-D
    • Atlanta
    • Austin
    • Baltimore
    • Birmingham
    • Boston
    • Buffalo
    • Charlotte
    • Chicago
    • Cincinnati
    • Cleveland
    • Columbus
    • Dallas
    • Denver
    • Detroit
  • E-H
    • Hartford
    • Houston
  • I-L
    • Indianapolis
    • Jacksonville
    • Kansas City
    • Las Vegas
    • Los Angeles
    • Louisville
  • M-P
    • Memphis
    • Miami
    • Milwaukee
    • Minneapolis
    • Nashville
    • New Orleans
    • New York
    • North Port
    • Oklahoma
    • Orlando
    • Philadelphia
    • Phoenix
    • Pittsburgh
    • Portland
    • Providence
  • Q-T
    • Raleigh
    • Richmond
    • Riverside
    • Sacramento
    • San Antonio
    • San Diego
    • San Francisco
    • San Jose
    • Seattle
    • St. Louis
    • Tampa
  • U-X
    • Virginia Beach
    • Washington
Reliability Experience
in Atlanta
100-1000 points
AT&T Fiber
771
Spectrum
754
Xfinity
733
T-Mobile 5G Home Internet
628
AT&T Non Fiber
627
Verizon 5G Home Internet
611
Download Image
Consistent Quality
in Atlanta
% of tests
Spectrum
81.8
AT&T Fiber
81.7
Xfinity
80.7
Verizon 5G Home Internet
77.1
T-Mobile 5G Home Internet
75.4
AT&T Non Fiber
67.2
Download Image
Download Speed
in Atlanta
in Mbps
AT&T Fiber
244.3
Spectrum
211.2
Xfinity
194.1
AT&T Non Fiber
160.9
T-Mobile 5G Home Internet
151.1
Verizon 5G Home Internet
119.4
Download Image
Upload Speed
in Atlanta
in Mbps
AT&T Fiber
170.7
AT&T Non Fiber
103.3
Xfinity
40.0
T-Mobile 5G Home Internet
25.3
Spectrum
18.3
Verizon 5G Home Internet
14.6
Download Image
Video Experience
in Atlanta
in 0-100 points
AT&T Fiber
77.8
Spectrum
77.3
Xfinity
77.1
T-Mobile 5G Home Internet
75.1
Verizon 5G Home Internet
74.7
AT&T Non Fiber
74.6
Download Image
Reliability Experience
in Austin
100-1000 points
Google Fiber
822
AT&T Fiber
755
Spectrum
747
T-Mobile 5G Home Internet
679
AT&T Non Fiber
646
Verizon 5G Home Internet
573
Download Image
Consistent Quality
in Austin
% of tests
Google Fiber
88.6
AT&T Fiber
84.1
Spectrum
82.0
T-Mobile 5G Home Internet
79.2
Verizon 5G Home Internet
77.3
AT&T Non Fiber
70.8
Download Image
Download Speed
in Austin
in Mbps
AT&T Fiber
271.4
Google Fiber
232.7
Spectrum
220.9
AT&T Non Fiber
182.3
T-Mobile 5G Home Internet
142.2
Verizon 5G Home Internet
111.9
Download Image
Upload Speed
in Austin
in Mbps
AT&T Fiber
182.2
Google Fiber
153.3
AT&T Non Fiber
122.1
T-Mobile 5G Home Internet
22.8
Spectrum
18.4
Verizon 5G Home Internet
14.1
Download Image
Video Experience
in Austin
in 0-100 points
AT&T Fiber
78.5
Google Fiber
77.4
Spectrum
76.9
AT&T Non Fiber
75.7
T-Mobile 5G Home Internet
75.7
Verizon 5G Home Internet
74.8
Download Image
Reliability Experience
in Baltimore
100-1000 points
Verizon FiOS
818
Xfinity
755
T-Mobile 5G Home Internet
676
Verizon 5G Home Internet
597
Download Image
Consistent Quality
in Baltimore
% of tests
Verizon FiOS
89.0
Xfinity
81.4
Verizon 5G Home Internet
78.3
T-Mobile 5G Home Internet
77.7
Download Image
Download Speed
in Baltimore
in Mbps
Verizon FiOS
235.0
Xfinity
201.2
T-Mobile 5G Home Internet
144.6
Verizon 5G Home Internet
101.2
Download Image
Upload Speed
in Baltimore
in Mbps
Verizon FiOS
127.7
Xfinity
44.1
T-Mobile 5G Home Internet
27.6
Verizon 5G Home Internet
16.1
Download Image
Video Experience
in Baltimore
in 0-100 points
Verizon FiOS
77.8
Xfinity
76.8
T-Mobile 5G Home Internet
75.3
Verizon 5G Home Internet
73.7
Download Image
Reliability Experience
in Birmingham
100-1000 points
Spectrum
749
AT&T Fiber
745
T-Mobile 5G Home Internet
645
Verizon 5G Home Internet
621
AT&T Non Fiber
561
Download Image
Consistent Quality
in Birmingham
% of tests
Spectrum
81.3
AT&T Fiber
80.4
T-Mobile 5G Home Internet
78.4
Verizon 5G Home Internet
76.2
AT&T Non Fiber
66.3
Download Image
Download Speed
in Birmingham
in Mbps
AT&T Fiber
241.0
Spectrum
194.5
T-Mobile 5G Home Internet
155.3
AT&T Non Fiber
143.3
Verizon 5G Home Internet
99.8
Download Image
Upload Speed
in Birmingham
in Mbps
AT&T Fiber
169.3
AT&T Non Fiber
98.3
T-Mobile 5G Home Internet
24.7
Spectrum
16.1
Verizon 5G Home Internet
13.0
Download Image
Video Experience
in Birmingham
in 0-100 points
AT&T Fiber
77.2
Spectrum
76.7
T-Mobile 5G Home Internet
73.9
Verizon 5G Home Internet
73.8
AT&T Non Fiber
73.8
Download Image
Reliability Experience
in Boston
100-1000 points
Verizon FiOS
806
Astound Broadband
780
Xfinity
759
T-Mobile 5G Home Internet
685
Download Image
Consistent Quality
in Boston
% of tests
Verizon FiOS
87.7
Astound Broadband
85.9
Xfinity
82.5
T-Mobile 5G Home Internet
77.9
Download Image
Download Speed
in Boston
in Mbps
Verizon FiOS
225.6
Xfinity
212.9
Astound Broadband
171.3
T-Mobile 5G Home Internet
153.5
Download Image
Upload Speed
in Boston
in Mbps
Verizon FiOS
130.5
Xfinity
47.3
Astound Broadband
30.0
T-Mobile 5G Home Internet
29.7
Download Image
Video Experience
in Boston
in 0-100 points
Verizon FiOS
78.0
Astound Broadband
77.1
Xfinity
76.9
T-Mobile 5G Home Internet
75.9
Download Image
Reliability Experience
in Buffalo
100-1000 points
Verizon FiOS
824
Spectrum
759
Verizon 5G Home Internet
647
T-Mobile 5G Home Internet
644
Download Image
Consistent Quality
in Buffalo
% of tests
Verizon FiOS
88.8
Spectrum
81.2
Verizon 5G Home Internet
79.6
T-Mobile 5G Home Internet
77.8
Download Image
Download Speed
in Buffalo
in Mbps
Verizon FiOS
250.6
Spectrum
196.9
T-Mobile 5G Home Internet
141.7
Verizon 5G Home Internet
122.3
Download Image
Upload Speed
in Buffalo
in Mbps
Verizon FiOS
153.6
T-Mobile 5G Home Internet
27.6
Spectrum
15.4
Verizon 5G Home Internet
15.3
Download Image
Video Experience
in Buffalo
in 0-100 points
Verizon FiOS
78.4
Spectrum
76.6
T-Mobile 5G Home Internet
76.2
Verizon 5G Home Internet
75.0
Download Image
Reliability Experience
in Charlotte
100-1000 points
AT&T Fiber
767
Spectrum
757
T-Mobile 5G Home Internet
705
Verizon 5G Home Internet
639
Download Image
Consistent Quality
in Charlotte
% of tests
AT&T Fiber
82.0
Spectrum
80.8
T-Mobile 5G Home Internet
79.3
Verizon 5G Home Internet
76.7
Download Image
Download Speed
in Charlotte
in Mbps
AT&T Fiber
259.7
Spectrum
211.0
T-Mobile 5G Home Internet
165.9
Verizon 5G Home Internet
120.9
Download Image
Upload Speed
in Charlotte
in Mbps
AT&T Fiber
176.6
T-Mobile 5G Home Internet
25.3
Spectrum
17.3
Verizon 5G Home Internet
14.8
Download Image
Video Experience
in Charlotte
in 0-100 points
AT&T Fiber
77.8
Spectrum
77.2
T-Mobile 5G Home Internet
75.8
Verizon 5G Home Internet
74.6
Download Image
Reliability Experience
in Chicago
100-1000 points
AT&T Fiber
770
Astound Broadband
766
Xfinity
757
T-Mobile 5G Home Internet
738
Verizon 5G Home Internet
694
AT&T Non Fiber
574
Download Image
Consistent Quality
in Chicago
% of tests
Astound Broadband
84.3
AT&T Fiber
83.0
Xfinity
81.1
T-Mobile 5G Home Internet
80.9
Verizon 5G Home Internet
80.4
AT&T Non Fiber
63.9
Download Image
Download Speed
in Chicago
in Mbps
AT&T Fiber
256.1
Xfinity
208.1
Astound Broadband
168.0
T-Mobile 5G Home Internet
148.8
Verizon 5G Home Internet
133.0
AT&T Non Fiber
78.6
Download Image
Upload Speed
in Chicago
in Mbps
AT&T Fiber
185.9
Xfinity
45.0
AT&T Non Fiber
37.7
T-Mobile 5G Home Internet
32.9
Astound Broadband
30.2
Verizon 5G Home Internet
17.5
Download Image
Video Experience
in Chicago
in 0-100 points
AT&T Fiber
77.8
Xfinity
77.2
Astound Broadband
77.0
T-Mobile 5G Home Internet
76.8
Verizon 5G Home Internet
75.5
AT&T Non Fiber
74.2
Download Image
Reliability Experience
in Cincinnati
100-1000 points
altafiber Fioptics
781
Spectrum
776
T-Mobile 5G Home Internet
739
Verizon 5G Home Internet
659
Download Image
Consistent Quality
in Cincinnati
% of tests
altafiber Fioptics
86.3
Spectrum
81.9
Verizon 5G Home Internet
81.8
T-Mobile 5G Home Internet
77.4
Download Image
Download Speed
in Cincinnati
in Mbps
Spectrum
220.7
altafiber Fioptics
187.1
T-Mobile 5G Home Internet
164.0
Verizon 5G Home Internet
118.9
Download Image
Upload Speed
in Cincinnati
in Mbps
altafiber Fioptics
141.8
Spectrum
96.5
T-Mobile 5G Home Internet
27.9
Verizon 5G Home Internet
15.8
Download Image
Video Experience
in Cincinnati
in 0-100 points
Spectrum
77.1
altafiber Fioptics
77.0
T-Mobile 5G Home Internet
76.1
Verizon 5G Home Internet
75.5
Download Image
Reliability Experience
in Cleveland
100-1000 points
AT&T Fiber
792
Spectrum
786
Breezeline
775
T-Mobile 5G Home Internet
727
AT&T Non Fiber
670
Verizon 5G Home Internet
657
Download Image
Consistent Quality
in Cleveland
% of tests
AT&T Fiber
85.3
Breezeline
85.2
Spectrum
83.5
T-Mobile 5G Home Internet
80.9
Verizon 5G Home Internet
79.6
AT&T Non Fiber
70.3
Download Image
Download Speed
in Cleveland
in Mbps
AT&T Fiber
260.8
Spectrum
204.2
Breezeline
184.3
T-Mobile 5G Home Internet
173.1
AT&T Non Fiber
154.5
Verizon 5G Home Internet
125.8
Download Image
Upload Speed
in Cleveland
in Mbps
AT&T Fiber
204.6
AT&T Non Fiber
99.3
Breezeline
29.2
T-Mobile 5G Home Internet
28.6
Verizon 5G Home Internet
17.9
Spectrum
16.3
Download Image
Video Experience
in Cleveland
in 0-100 points
AT&T Fiber
77.7
Breezeline
77.1
Spectrum
76.8
T-Mobile 5G Home Internet
76.6
Verizon 5G Home Internet
74.8
AT&T Non Fiber
74.4
Download Image
Reliability Experience
in Columbus
100-1000 points
AT&T Fiber
787
Spectrum
778
Breezeline
753
T-Mobile 5G Home Internet
709
Verizon 5G Home Internet
624
AT&T Non Fiber
614
Download Image
Consistent Quality
in Columbus
% of tests
AT&T Fiber
86.4
Breezeline
84.2
Spectrum
83.1
Verizon 5G Home Internet
79.5
T-Mobile 5G Home Internet
77.5
AT&T Non Fiber
69.4
Download Image
Download Speed
in Columbus
in Mbps
AT&T Fiber
271.1
Spectrum
210.2
Breezeline
185.0
T-Mobile 5G Home Internet
159.7
AT&T Non Fiber
129.2
Verizon 5G Home Internet
112.3
Download Image
Upload Speed
in Columbus
in Mbps
AT&T Fiber
206.9
AT&T Non Fiber
81.4
Breezeline
27.8
T-Mobile 5G Home Internet
27.6
Spectrum
16.5
Verizon 5G Home Internet
15.4
Download Image
Video Experience
in Columbus
in 0-100 points
AT&T Fiber
77.5
Breezeline
77.3
Spectrum
77.1
T-Mobile 5G Home Internet
76.1
Verizon 5G Home Internet
74.6
AT&T Non Fiber
74.6
Download Image
Reliability Experience
in Dallas
100-1000 points
Frontier - Fiber
788
AT&T Fiber
777
Spectrum
764
AT&T Non Fiber
691
T-Mobile 5G Home Internet
688
Verizon 5G Home Internet
664
Download Image
Consistent Quality
in Dallas
% of tests
Frontier - Fiber
88.1
AT&T Fiber
84.1
Spectrum
81.6
Verizon 5G Home Internet
80.6
T-Mobile 5G Home Internet
77.8
AT&T Non Fiber
76.1
Download Image
Download Speed
in Dallas
in Mbps
AT&T Fiber
272.0
Frontier - Fiber
217.1
Spectrum
214.5
AT&T Non Fiber
211.1
T-Mobile 5G Home Internet
124.6
Verizon 5G Home Internet
120.3
Download Image
Upload Speed
in Dallas
in Mbps
AT&T Fiber
197.0
AT&T Non Fiber
150.5
Frontier - Fiber
147.6
Spectrum
90.1
T-Mobile 5G Home Internet
27.9
Verizon 5G Home Internet
16.8
Download Image
Video Experience
in Dallas
in 0-100 points
AT&T Fiber
78.4
Frontier - Fiber
78.4
Spectrum
77.2
AT&T Non Fiber
76.7
T-Mobile 5G Home Internet
76.1
Verizon 5G Home Internet
75.6
Download Image
Reliability Experience
in Denver
100-1000 points
Xfinity
762
Quantum Fiber
748
T-Mobile 5G Home Internet
704
CenturyLink Internet
609
Verizon 5G Home Internet
597
Download Image
Consistent Quality
in Denver
% of tests
Xfinity
83.0
Quantum Fiber
81.1
T-Mobile 5G Home Internet
79.8
Verizon 5G Home Internet
78.4
CenturyLink Internet
72.2
Download Image
Download Speed
in Denver
in Mbps
Xfinity
236.4
Quantum Fiber
193.1
Verizon 5G Home Internet
156.4
T-Mobile 5G Home Internet
126.6
CenturyLink Internet
92.1
Download Image
Upload Speed
in Denver
in Mbps
Quantum Fiber
132.0
Xfinity
52.2
CenturyLink Internet
46.9
T-Mobile 5G Home Internet
27.1
Verizon 5G Home Internet
17.0
Download Image
Video Experience
in Denver
in 0-100 points
Xfinity
77.6
Quantum Fiber
77.3
T-Mobile 5G Home Internet
76.2
Verizon 5G Home Internet
75.4
CenturyLink Internet
74.8
Download Image
Reliability Experience
in Detroit
100-1000 points
AT&T Fiber
790
Xfinity
774
WOW!
741
Verizon 5G Home Internet
678
T-Mobile 5G Home Internet
678
AT&T Non Fiber
572
Download Image
Consistent Quality
in Detroit
% of tests
AT&T Fiber
84.8
Xfinity
82.6
WOW!
81.2
T-Mobile 5G Home Internet
80.0
Verizon 5G Home Internet
79.9
AT&T Non Fiber
65.4
Download Image
Download Speed
in Detroit
in Mbps
AT&T Fiber
266.5
Xfinity
207.7
WOW!
163.7
T-Mobile 5G Home Internet
127.4
Verizon 5G Home Internet
127.4
AT&T Non Fiber
94.4
Download Image
Upload Speed
in Detroit
in Mbps
AT&T Fiber
201.5
AT&T Non Fiber
51.4
Xfinity
33.2
WOW!
29.5
T-Mobile 5G Home Internet
26.6
Verizon 5G Home Internet
16.2
Download Image
Video Experience
in Detroit
in 0-100 points
AT&T Fiber
77.9
Xfinity
77.1
WOW!
76.7
Verizon 5G Home Internet
75.9
T-Mobile 5G Home Internet
75.3
AT&T Non Fiber
73.3
Download Image
Reliability Experience
in Hartford
100-1000 points
GoNetspeed
835
Frontier - Fiber
819
Cox Internet
796
Xfinity
763
T-Mobile 5G Home Internet
682
Download Image
Consistent Quality
in Hartford
% of tests
Frontier - Fiber
89.9
GoNetspeed
86.7
Cox Internet
85.8
Xfinity
82.9
T-Mobile 5G Home Internet
77.8
Download Image
Download Speed
in Hartford
in Mbps
Frontier - Fiber
262.1
Cox Internet
227.6
GoNetspeed
223.6
Xfinity
205.5
T-Mobile 5G Home Internet
146.9
Download Image
Upload Speed
in Hartford
in Mbps
Frontier - Fiber
194.4
GoNetspeed
180.5
Xfinity
51.8
Cox Internet
36.9
T-Mobile 5G Home Internet
28.4
Download Image
Video Experience
in Hartford
in 0-100 points
GoNetspeed
78.0
Cox Internet
77.8
Frontier - Fiber
77.6
Xfinity
76.7
T-Mobile 5G Home Internet
76.4
Download Image
Reliability Experience
in Houston
100-1000 points
AT&T Fiber
763
Xfinity
725
T-Mobile 5G Home Internet
706
AT&T Non Fiber
667
Verizon 5G Home Internet
602
Download Image
Consistent Quality
in Houston
% of tests
AT&T Fiber
84.1
Xfinity
81.9
T-Mobile 5G Home Internet
80.0
Verizon 5G Home Internet
78.0
AT&T Non Fiber
72.6
Download Image
Download Speed
in Houston
in Mbps
AT&T Fiber
255.2
Xfinity
196.1
AT&T Non Fiber
192.6
T-Mobile 5G Home Internet
134.1
Verizon 5G Home Internet
109.0
Download Image
Upload Speed
in Houston
in Mbps
AT&T Fiber
188.1
AT&T Non Fiber
136.1
Xfinity
47.4
T-Mobile 5G Home Internet
29.6
Verizon 5G Home Internet
14.5
Download Image
Video Experience
in Houston
in 0-100 points
AT&T Fiber
77.9
Xfinity
77.1
AT&T Non Fiber
75.8
T-Mobile 5G Home Internet
75.5
Verizon 5G Home Internet
74.7
Download Image
Reliability Experience
in Indianapolis
100-1000 points
Spectrum
788
AT&T Fiber
783
Xfinity
741
T-Mobile 5G Home Internet
733
Verizon 5G Home Internet
688
AT&T Non Fiber
616
Download Image
Consistent Quality
in Indianapolis
% of tests
AT&T Fiber
83.3
Spectrum
82.8
T-Mobile 5G Home Internet
81.8
Xfinity
81.3
Verizon 5G Home Internet
80.1
AT&T Non Fiber
66.3
Download Image
Download Speed
in Indianapolis
in Mbps
AT&T Fiber
260.0
Spectrum
227.2
Xfinity
204.0
T-Mobile 5G Home Internet
156.5
Verizon 5G Home Internet
128.8
AT&T Non Fiber
128.3
Download Image
Upload Speed
in Indianapolis
in Mbps
AT&T Fiber
193.3
AT&T Non Fiber
82.7
Xfinity
36.2
T-Mobile 5G Home Internet
26.8
Spectrum
18.8
Verizon 5G Home Internet
17.9
Download Image
Video Experience
in Indianapolis
in 0-100 points
AT&T Fiber
78.0
Xfinity
77.0
Spectrum
76.8
T-Mobile 5G Home Internet
76.3
Verizon 5G Home Internet
76.1
AT&T Non Fiber
74.9
Download Image
Reliability Experience
in Jacksonville
100-1000 points
AT&T Fiber
758
Xfinity
724
AT&T Non Fiber
645
Verizon 5G Home Internet
635
T-Mobile 5G Home Internet
598
Download Image
Consistent Quality
in Jacksonville
% of tests
AT&T Fiber
81.8
Xfinity
80.2
Verizon 5G Home Internet
77.2
T-Mobile 5G Home Internet
76.1
AT&T Non Fiber
70.3
Download Image
Download Speed
in Jacksonville
in Mbps
AT&T Fiber
249.6
Xfinity
195.1
AT&T Non Fiber
162.2
T-Mobile 5G Home Internet
135.5
Verizon 5G Home Internet
116.5
Download Image
Upload Speed
in Jacksonville
in Mbps
AT&T Fiber
178.9
AT&T Non Fiber
103.8
Xfinity
38.9
T-Mobile 5G Home Internet
24.5
Verizon 5G Home Internet
14.2
Download Image
Video Experience
in Jacksonville
in 0-100 points
AT&T Fiber
77.4
Xfinity
76.6
T-Mobile 5G Home Internet
75.5
AT&T Non Fiber
75.0
Verizon 5G Home Internet
74.4
Download Image
Reliability Experience
in Kansas City
100-1000 points
Google Fiber
807
AT&T Fiber
777
Spectrum
730
T-Mobile 5G Home Internet
719
Verizon 5G Home Internet
677
AT&T Non Fiber
625
Download Image
Consistent Quality
in Kansas City
% of tests
Google Fiber
87.4
AT&T Fiber
84.9
Spectrum
79.0
Verizon 5G Home Internet
78.3
T-Mobile 5G Home Internet
77.9
AT&T Non Fiber
67.0
Download Image
Download Speed
in Kansas City
in Mbps
AT&T Fiber
269.7
Google Fiber
218.4
Spectrum
216.1
T-Mobile 5G Home Internet
155.3
AT&T Non Fiber
150.3
Verizon 5G Home Internet
121.1
Download Image
Upload Speed
in Kansas City
in Mbps
AT&T Fiber
203.5
Google Fiber
151.0
AT&T Non Fiber
100.8
T-Mobile 5G Home Internet
28.1
Spectrum
18.3
Verizon 5G Home Internet
15.3
Download Image
Video Experience
in Kansas City
in 0-100 points
Google Fiber
77.8
AT&T Fiber
77.7
Spectrum
76.7
T-Mobile 5G Home Internet
76.2
Verizon 5G Home Internet
75.2
AT&T Non Fiber
74.9
Download Image
Reliability Experience
in Las Vegas
100-1000 points
Cox Internet
770
Quantum Fiber
714
Verizon 5G Home Internet
677
CenturyLink Internet
519
T-Mobile 5G Home Internet
510
Download Image
Consistent Quality
in Las Vegas
% of tests
Cox Internet
84.6
Quantum Fiber
80.4
Verizon 5G Home Internet
79.9
T-Mobile 5G Home Internet
73.8
CenturyLink Internet
67.8
Download Image
Download Speed
in Las Vegas
in Mbps
Cox Internet
198.4
Quantum Fiber
181.1
Verizon 5G Home Internet
124.7
T-Mobile 5G Home Internet
82.6
CenturyLink Internet
71.0
Download Image
Upload Speed
in Las Vegas
in Mbps
Quantum Fiber
120.5
Cox Internet
43.7
CenturyLink Internet
32.3
T-Mobile 5G Home Internet
25.5
Verizon 5G Home Internet
15.9
Download Image
Video Experience
in Las Vegas
in 0-100 points
Cox Internet
77.1
Quantum Fiber
76.7
Verizon 5G Home Internet
75.4
CenturyLink Internet
73.0
T-Mobile 5G Home Internet
72.7
Download Image
Reliability Experience
in Los Angeles
100-1000 points
Frontier - Fiber
790
Spectrum
776
AT&T Fiber
730
T-Mobile 5G Home Internet
658
Verizon 5G Home Internet
606
AT&T Non Fiber
575
Download Image
Consistent Quality
in Los Angeles
% of tests
Frontier - Fiber
86.2
Spectrum
82.1
AT&T Fiber
78.9
Verizon 5G Home Internet
77.5
T-Mobile 5G Home Internet
76.1
AT&T Non Fiber
63.6
Download Image
Download Speed
in Los Angeles
in Mbps
AT&T Fiber
210.7
Frontier - Fiber
199.0
Spectrum
193.2
T-Mobile 5G Home Internet
138.3
Verizon 5G Home Internet
101.4
AT&T Non Fiber
93.9
Download Image
Upload Speed
in Los Angeles
in Mbps
AT&T Fiber
142.8
Frontier - Fiber
139.1
AT&T Non Fiber
51.8
T-Mobile 5G Home Internet
30.0
Spectrum
16.5
Verizon 5G Home Internet
14.8
Download Image
Video Experience
in Los Angeles
in 0-100 points
Frontier - Fiber
77.9
AT&T Fiber
77.5
Spectrum
77.0
T-Mobile 5G Home Internet
75.6
Verizon 5G Home Internet
74.2
AT&T Non Fiber
73.8
Download Image
Reliability Experience
in Louisville
100-1000 points
AT&T Fiber
762
Spectrum
759
T-Mobile 5G Home Internet
727
Verizon 5G Home Internet
693
AT&T Non Fiber
692
Download Image
Consistent Quality
in Louisville
% of tests
AT&T Fiber
83.0
Verizon 5G Home Internet
81.1
Spectrum
80.9
T-Mobile 5G Home Internet
77.4
AT&T Non Fiber
74.0
Download Image
Download Speed
in Louisville
in Mbps
AT&T Fiber
261.1
Spectrum
202.5
AT&T Non Fiber
192.3
T-Mobile 5G Home Internet
139.1
Verizon 5G Home Internet
134.9
Download Image
Upload Speed
in Louisville
in Mbps
AT&T Fiber
186.7
AT&T Non Fiber
133.8
Spectrum
72.0
T-Mobile 5G Home Internet
24.4
Verizon 5G Home Internet
15.3
Download Image
Video Experience
in Louisville
in 0-100 points
AT&T Fiber
77.7
Spectrum
76.5
AT&T Non Fiber
76.5
T-Mobile 5G Home Internet
76.2
Verizon 5G Home Internet
76.0
Download Image
Reliability Experience
in Memphis
100-1000 points
AT&T Fiber
734
T-Mobile 5G Home Internet
718
Xfinity
682
AT&T Non Fiber
541
Download Image
Consistent Quality
in Memphis
% of tests
AT&T Fiber
81.6
T-Mobile 5G Home Internet
79.2
Xfinity
75.6
AT&T Non Fiber
64.2
Download Image
Download Speed
in Memphis
in Mbps
AT&T Fiber
225.5
Xfinity
159.2
T-Mobile 5G Home Internet
139.3
AT&T Non Fiber
106.9
Download Image
Upload Speed
in Memphis
in Mbps
AT&T Fiber
161.2
AT&T Non Fiber
64.9
Xfinity
37.9
T-Mobile 5G Home Internet
25.9
Download Image
Video Experience
in Memphis
in 0-100 points
AT&T Fiber
77.4
Xfinity
75.8
T-Mobile 5G Home Internet
75.0
AT&T Non Fiber
72.9
Download Image
Reliability Experience
in Miami
100-1000 points
AT&T Fiber
757
Xfinity
725
AT&T Non Fiber
666
Verizon 5G Home Internet
632
T-Mobile 5G Home Internet
585
Download Image
Consistent Quality
in Miami
% of tests
AT&T Fiber
81.7
Xfinity
78.9
Verizon 5G Home Internet
74.5
T-Mobile 5G Home Internet
73.6
AT&T Non Fiber
69.7
Download Image
Download Speed
in Miami
in Mbps
AT&T Fiber
234.4
Xfinity
186.2
AT&T Non Fiber
157.7
T-Mobile 5G Home Internet
147.8
Verizon 5G Home Internet
118.9
Download Image
Upload Speed
in Miami
in Mbps
AT&T Fiber
176.3
AT&T Non Fiber
110.6
Xfinity
40.8
T-Mobile 5G Home Internet
26.6
Verizon 5G Home Internet
14.2
Download Image
Video Experience
in Miami
in 0-100 points
AT&T Fiber
77.7
Xfinity
76.7
AT&T Non Fiber
75.7
T-Mobile 5G Home Internet
75.1
Verizon 5G Home Internet
73.8
Download Image
Reliability Experience
in Milwaukee
100-1000 points
AT&T Fiber
790
Spectrum
770
T-Mobile 5G Home Internet
753
Verizon 5G Home Internet
664
AT&T Non Fiber
616
Download Image
Consistent Quality
in Milwaukee
% of tests
AT&T Fiber
84.8
Spectrum
83.5
T-Mobile 5G Home Internet
81.7
Verizon 5G Home Internet
81.0
AT&T Non Fiber
70.7
Download Image
Download Speed
in Milwaukee
in Mbps
AT&T Fiber
262.7
Spectrum
213.5
T-Mobile 5G Home Internet
152.8
Verizon 5G Home Internet
131.0
AT&T Non Fiber
116.0
Download Image
Upload Speed
in Milwaukee
in Mbps
AT&T Fiber
205.9
AT&T Non Fiber
74.9
T-Mobile 5G Home Internet
26.7
Verizon 5G Home Internet
17.4
Spectrum
15.3
Download Image
Video Experience
in Milwaukee
in 0-100 points
AT&T Fiber
77.9
Spectrum
77.4
T-Mobile 5G Home Internet
76.6
Verizon 5G Home Internet
75.9
AT&T Non Fiber
75.3
Download Image
Reliability Experience
in Minneapolis
100-1000 points
Quantum Fiber
765
Xfinity
763
T-Mobile 5G Home Internet
710
Verizon 5G Home Internet
678
CenturyLink Internet
561
Download Image
Consistent Quality
in Minneapolis
% of tests
Xfinity
82.3
Quantum Fiber
79.4
Verizon 5G Home Internet
78.6
T-Mobile 5G Home Internet
78.6
CenturyLink Internet
69.0
Download Image
Download Speed
in Minneapolis
in Mbps
Xfinity
216.1
Quantum Fiber
176.0
T-Mobile 5G Home Internet
156.6
Verizon 5G Home Internet
129.7
CenturyLink Internet
69.3
Download Image
Upload Speed
in Minneapolis
in Mbps
Quantum Fiber
129.8
Xfinity
35.9
CenturyLink Internet
32.8
T-Mobile 5G Home Internet
29.2
Verizon 5G Home Internet
16.8
Download Image
Video Experience
in Minneapolis
in 0-100 points
Quantum Fiber
77.4
Xfinity
77.2
T-Mobile 5G Home Internet
76.8
Verizon 5G Home Internet
75.2
CenturyLink Internet
73.7
Download Image
Reliability Experience
in Nashville
100-1000 points
AT&T Fiber
763
Xfinity
726
T-Mobile 5G Home Internet
721
AT&T Non Fiber
649
Verizon 5G Home Internet
605
Download Image
Consistent Quality
in Nashville
% of tests
AT&T Fiber
81.9
Xfinity
80.9
T-Mobile 5G Home Internet
79.3
Verizon 5G Home Internet
72.7
AT&T Non Fiber
68.8
Download Image
Download Speed
in Nashville
in Mbps
AT&T Fiber
269.3
AT&T Non Fiber
191.5
Xfinity
186.3
T-Mobile 5G Home Internet
150.2
Verizon 5G Home Internet
122.2
Download Image
Upload Speed
in Nashville
in Mbps
AT&T Fiber
190.7
AT&T Non Fiber
129.0
Xfinity
45.2
T-Mobile 5G Home Internet
25.6
Verizon 5G Home Internet
15.3
Download Image
Video Experience
in Nashville
in 0-100 points
AT&T Fiber
77.9
Xfinity
76.7
T-Mobile 5G Home Internet
76.4
AT&T Non Fiber
74.9
Verizon 5G Home Internet
74.4
Download Image
Reliability Experience
in New Orleans
100-1000 points
AT&T Fiber
750
T-Mobile 5G Home Internet
678
Cox Internet
667
Verizon 5G Home Internet
621
AT&T Non Fiber
615
Download Image
Consistent Quality
in New Orleans
% of tests
AT&T Fiber
82.6
T-Mobile 5G Home Internet
77.9
Cox Internet
77.7
Verizon 5G Home Internet
76.7
AT&T Non Fiber
68.2
Download Image
Download Speed
in New Orleans
in Mbps
AT&T Fiber
231.7
Cox Internet
166.0
AT&T Non Fiber
159.0
T-Mobile 5G Home Internet
124.3
Verizon 5G Home Internet
111.9
Download Image
Upload Speed
in New Orleans
in Mbps
AT&T Fiber
172.5
AT&T Non Fiber
103.1
T-Mobile 5G Home Internet
26.1
Cox Internet
18.9
Verizon 5G Home Internet
15.6
Download Image
Video Experience
in New Orleans
in 0-100 points
AT&T Fiber
77.3
Cox Internet
75.9
T-Mobile 5G Home Internet
74.6
AT&T Non Fiber
73.9
Verizon 5G Home Internet
73.5
Download Image
Reliability Experience
in New York
100-1000 points
Verizon FiOS
801
Optimum
784
Xfinity
763
Spectrum
761
T-Mobile 5G Home Internet
673
Verizon 5G Home Internet
633
Download Image
Consistent Quality
in New York
% of tests
Verizon FiOS
87.0
Optimum
85.2
Xfinity
82.2
Verizon 5G Home Internet
81.2
Spectrum
80.9
T-Mobile 5G Home Internet
77.6
Download Image
Download Speed
in New York
in Mbps
Verizon FiOS
250.7
Xfinity
225.8
Spectrum
223.1
Optimum
219.6
T-Mobile 5G Home Internet
128.2
Verizon 5G Home Internet
109.8
Download Image
Upload Speed
in New York
in Mbps
Verizon FiOS
139.1
Optimum
60.6
Xfinity
46.9
T-Mobile 5G Home Internet
34.8
Spectrum
17.4
Verizon 5G Home Internet
15.7
Download Image
Video Experience
in New York
in 0-100 points
Verizon FiOS
78.1
Xfinity
77.3
Optimum
77.2
Spectrum
76.9
T-Mobile 5G Home Internet
74.7
Verizon 5G Home Internet
74.5
Download Image
Reliability Experience
in North Port
100-1000 points
Frontier - Fiber
778
Spectrum
774
Xfinity
734
Verizon 5G Home Internet
656
T-Mobile 5G Home Internet
586
Download Image
Consistent Quality
in North Port
% of tests
Frontier - Fiber
87.4
Spectrum
82.9
Xfinity
81.2
Verizon 5G Home Internet
80.5
T-Mobile 5G Home Internet
74.3
Download Image
Download Speed
in North Port
in Mbps
Spectrum
254.9
Frontier - Fiber
226.6
Xfinity
215.0
T-Mobile 5G Home Internet
144.4
Verizon 5G Home Internet
141.0
Download Image
Upload Speed
in North Port
in Mbps
Frontier - Fiber
154.0
Xfinity
30.8
T-Mobile 5G Home Internet
24.1
Spectrum
19.2
Verizon 5G Home Internet
16.5
Download Image
Video Experience
in North Port
in 0-100 points
Frontier - Fiber
77.8
Spectrum
77.4
Xfinity
77.1
Verizon 5G Home Internet
75.2
T-Mobile 5G Home Internet
74.5
Download Image
Reliability Experience
in Oklahoma
100-1000 points
AT&T Fiber
776
T-Mobile 5G Home Internet
729
Cox Internet
710
AT&T Non Fiber
652
Verizon 5G Home Internet
613
Download Image
Consistent Quality
in Oklahoma
% of tests
AT&T Fiber
83.5
Cox Internet
82.2
T-Mobile 5G Home Internet
80.0
Verizon 5G Home Internet
78.8
AT&T Non Fiber
70.5
Download Image
Download Speed
in Oklahoma
in Mbps
AT&T Fiber
288.4
AT&T Non Fiber
213.4
Cox Internet
176.6
T-Mobile 5G Home Internet
144.1
Verizon 5G Home Internet
106.3
Download Image
Upload Speed
in Oklahoma
in Mbps
AT&T Fiber
212.2
AT&T Non Fiber
150.6
Cox Internet
34.5
T-Mobile 5G Home Internet
30.5
Verizon 5G Home Internet
15.2
Download Image
Video Experience
in Oklahoma
in 0-100 points
AT&T Fiber
78.0
Cox Internet
76.4
AT&T Non Fiber
75.6
T-Mobile 5G Home Internet
75.4
Verizon 5G Home Internet
75.0
Download Image
Reliability Experience
in Orlando
100-1000 points
Spectrum
774
AT&T Fiber
769
Xfinity
729
Verizon 5G Home Internet
624
T-Mobile 5G Home Internet
565
CenturyLink Internet
458
Download Image
Consistent Quality
in Orlando
% of tests
Spectrum
82.3
AT&T Fiber
82.2
Xfinity
79.1
Verizon 5G Home Internet
78.1
T-Mobile 5G Home Internet
77.7
CenturyLink Internet
60.4
Download Image
Download Speed
in Orlando
in Mbps
AT&T Fiber
258.2
Spectrum
227.8
Xfinity
214.6
T-Mobile 5G Home Internet
143.1
Verizon 5G Home Internet
110.4
CenturyLink Internet
69.2
Download Image
Upload Speed
in Orlando
in Mbps
AT&T Fiber
189.8
CenturyLink Internet
39.5
Xfinity
27.4
T-Mobile 5G Home Internet
24.7
Spectrum
18.4
Verizon 5G Home Internet
14.1
Download Image
Video Experience
in Orlando
in 0-100 points
AT&T Fiber
77.5
Spectrum
77.1
Xfinity
76.6
T-Mobile 5G Home Internet
75.8
Verizon 5G Home Internet
75.3
CenturyLink Internet
70.5
Download Image
Reliability Experience
in Philadelphia
100-1000 points
Verizon FiOS
804
Xfinity
756
T-Mobile 5G Home Internet
718
Download Image
Consistent Quality
in Philadelphia
% of tests
Verizon FiOS
87.7
Xfinity
81.5
T-Mobile 5G Home Internet
79.6
Download Image
Download Speed
in Philadelphia
in Mbps
Verizon FiOS
230.1
Xfinity
205.5
T-Mobile 5G Home Internet
139.5
Download Image
Upload Speed
in Philadelphia
in Mbps
Verizon FiOS
130.3
Xfinity
42.0
T-Mobile 5G Home Internet
30.9
Download Image
Video Experience
in Philadelphia
in 0-100 points
Verizon FiOS
77.6
Xfinity
76.8
T-Mobile 5G Home Internet
75.8
Download Image
Reliability Experience
in Phoenix
100-1000 points
Cox Internet
778
Quantum Fiber
758
T-Mobile 5G Home Internet
725
Verizon 5G Home Internet
672
CenturyLink Internet
589
Download Image
Consistent Quality
in Phoenix
% of tests
Cox Internet
85.2
Verizon 5G Home Internet
77.8
Quantum Fiber
77.7
T-Mobile 5G Home Internet
76.8
CenturyLink Internet
71.6
Download Image
Download Speed
in Phoenix
in Mbps
Cox Internet
212.9
Quantum Fiber
189.6
Verizon 5G Home Internet
130.7
T-Mobile 5G Home Internet
127.1
CenturyLink Internet
61.8
Download Image
Upload Speed
in Phoenix
in Mbps
Quantum Fiber
117.2
Cox Internet
44.5
T-Mobile 5G Home Internet
28.2
CenturyLink Internet
22.3
Verizon 5G Home Internet
16.1
Download Image
Video Experience
in Phoenix
in 0-100 points
Cox Internet
77.5
Quantum Fiber
77.5
T-Mobile 5G Home Internet
76.2
Verizon 5G Home Internet
75.0
CenturyLink Internet
74.4
Download Image
Reliability Experience
in Pittsburgh
100-1000 points
Verizon FiOS
803
Xfinity
753
T-Mobile 5G Home Internet
745
Download Image
Consistent Quality
in Pittsburgh
% of tests
Verizon FiOS
87.8
Xfinity
82.4
T-Mobile 5G Home Internet
81.7
Download Image
Download Speed
in Pittsburgh
in Mbps
Verizon FiOS
228.5
Xfinity
218.1
T-Mobile 5G Home Internet
164.9
Download Image
Upload Speed
in Pittsburgh
in Mbps
Verizon FiOS
139.2
Xfinity
46.1
T-Mobile 5G Home Internet
25.5
Download Image
Video Experience
in Pittsburgh
in 0-100 points
Verizon FiOS
77.5
Xfinity
76.8
T-Mobile 5G Home Internet
76.4
Download Image
Reliability Experience
in Portland
100-1000 points
Ziply Fiber
793
Quantum Fiber
755
Xfinity
746
T-Mobile 5G Home Internet
739
Verizon 5G Home Internet
674
Download Image
Consistent Quality
in Portland
% of tests
Ziply Fiber
86.7
Xfinity
82.4
Quantum Fiber
82.3
Verizon 5G Home Internet
80.5
T-Mobile 5G Home Internet
78.1
Download Image
Download Speed
in Portland
in Mbps
Xfinity
209.1
Quantum Fiber
176.5
Ziply Fiber
170.2
T-Mobile 5G Home Internet
156.2
Verizon 5G Home Internet
109.2
Download Image
Upload Speed
in Portland
in Mbps
Quantum Fiber
128.9
Ziply Fiber
122.9
Xfinity
42.6
T-Mobile 5G Home Internet
27.9
Verizon 5G Home Internet
14.1
Download Image
Video Experience
in Portland
in 0-100 points
Ziply Fiber
77.6
Xfinity
77.0
Quantum Fiber
76.8
T-Mobile 5G Home Internet
76.6
Verizon 5G Home Internet
75.8
Download Image
Reliability Experience
in Providence
100-1000 points
Verizon FiOS
811
Cox Internet
767
Xfinity
761
T-Mobile 5G Home Internet
692
Download Image
Consistent Quality
in Providence
% of tests
Verizon FiOS
87.4
Cox Internet
83.8
Xfinity
82.6
T-Mobile 5G Home Internet
79.0
Download Image
Download Speed
in Providence
in Mbps
Verizon FiOS
233.2
Xfinity
210.0
Cox Internet
209.5
T-Mobile 5G Home Internet
162.6
Download Image
Upload Speed
in Providence
in Mbps
Verizon FiOS
142.0
Xfinity
42.4
Cox Internet
31.8
T-Mobile 5G Home Internet
31.1
Download Image
Video Experience
in Providence
in 0-100 points
Verizon FiOS
77.5
Cox Internet
76.9
T-Mobile 5G Home Internet
76.8
Xfinity
76.7
Download Image
Reliability Experience
in Raleigh
100-1000 points
Google Fiber
847
AT&T Fiber
779
Spectrum
766
T-Mobile 5G Home Internet
686
Verizon 5G Home Internet
657
Download Image
Consistent Quality
in Raleigh
% of tests
Google Fiber
89.4
Spectrum
82.1
AT&T Fiber
81.5
Verizon 5G Home Internet
78.9
T-Mobile 5G Home Internet
74.8
Download Image
Download Speed
in Raleigh
in Mbps
AT&T Fiber
263.3
Google Fiber
249.7
Spectrum
205.0
T-Mobile 5G Home Internet
166.6
Verizon 5G Home Internet
121.9
Download Image
Upload Speed
in Raleigh
in Mbps
AT&T Fiber
179.4
Google Fiber
147.5
T-Mobile 5G Home Internet
19.2
Spectrum
17.3
Verizon 5G Home Internet
13.1
Download Image
Video Experience
in Raleigh
in 0-100 points
Google Fiber
77.8
AT&T Fiber
77.7
Spectrum
77.0
T-Mobile 5G Home Internet
75.1
Verizon 5G Home Internet
73.8
Download Image
Reliability Experience
in Richmond
100-1000 points
Verizon FiOS
805
Xfinity
730
T-Mobile 5G Home Internet
656
Download Image
Consistent Quality
in Richmond
% of tests
Verizon FiOS
87.3
Xfinity
81.5
T-Mobile 5G Home Internet
78.4
Download Image
Download Speed
in Richmond
in Mbps
Verizon FiOS
232.3
Xfinity
196.4
T-Mobile 5G Home Internet
149.9
Download Image
Upload Speed
in Richmond
in Mbps
Verizon FiOS
127.1
Xfinity
25.7
T-Mobile 5G Home Internet
22.8
Download Image
Video Experience
in Richmond
in 0-100 points
Verizon FiOS
77.6
Xfinity
76.7
T-Mobile 5G Home Internet
74.8
Download Image
Reliability Experience
in Riverside
100-1000 points
Frontier - Fiber
790
Spectrum
787
Frontier - Non-Fiber
686
T-Mobile 5G Home Internet
668
Verizon 5G Home Internet
621
AT&T Non Fiber
547
Download Image
Consistent Quality
in Riverside
% of tests
Frontier - Fiber
87.1
Spectrum
83.0
Frontier - Non-Fiber
77.3
Verizon 5G Home Internet
76.5
T-Mobile 5G Home Internet
73.8
AT&T Non Fiber
60.6
Download Image
Download Speed
in Riverside
in Mbps
Spectrum
210.2
Frontier - Fiber
209.9
Frontier - Non-Fiber
165.4
T-Mobile 5G Home Internet
123.8
Verizon 5G Home Internet
102.9
AT&T Non Fiber
64.1
Download Image
Upload Speed
in Riverside
in Mbps
Frontier - Fiber
141.1
Frontier - Non-Fiber
110.1
AT&T Non Fiber
27.5
T-Mobile 5G Home Internet
25.1
Spectrum
17.7
Verizon 5G Home Internet
14.6
Download Image
Video Experience
in Riverside
in 0-100 points
Frontier - Fiber
77.9
Spectrum
77.3
T-Mobile 5G Home Internet
75.2
Frontier - Non-Fiber
75.0
Verizon 5G Home Internet
74.4
AT&T Non Fiber
74.2
Download Image
Reliability Experience
in Sacramento
100-1000 points
Xfinity
766
AT&T Fiber
752
T-Mobile 5G Home Internet
682
Verizon 5G Home Internet
661
AT&T Non Fiber
547
Download Image
Consistent Quality
in Sacramento
% of tests
Xfinity
82.6
AT&T Fiber
81.7
T-Mobile 5G Home Internet
78.5
Verizon 5G Home Internet
74.2
AT&T Non Fiber
60.5
Download Image
Download Speed
in Sacramento
in Mbps
AT&T Fiber
237.9
Xfinity
203.7
T-Mobile 5G Home Internet
124.5
Verizon 5G Home Internet
119.5
AT&T Non Fiber
89.8
Download Image
Upload Speed
in Sacramento
in Mbps
AT&T Fiber
169.1
AT&T Non Fiber
48.9
Xfinity
47.6
T-Mobile 5G Home Internet
19.8
Verizon 5G Home Internet
15.4
Download Image
Video Experience
in Sacramento
in 0-100 points
AT&T Fiber
78.0
Xfinity
77.0
Verizon 5G Home Internet
76.4
T-Mobile 5G Home Internet
75.5
AT&T Non Fiber
74.1
Download Image
Reliability Experience
in San Antonio
100-1000 points
Google Fiber
829
AT&T Fiber
751
Spectrum
747
T-Mobile 5G Home Internet
674
AT&T Non Fiber
658
Verizon 5G Home Internet
609
Download Image
Consistent Quality
in San Antonio
% of tests
Google Fiber
90.1
AT&T Fiber
83.4
Spectrum
81.1
Verizon 5G Home Internet
79.5
T-Mobile 5G Home Internet
77.0
AT&T Non Fiber
71.1
Download Image
Download Speed
in San Antonio
in Mbps
AT&T Fiber
270.1
Google Fiber
229.2
Spectrum
211.8
AT&T Non Fiber
189.0
T-Mobile 5G Home Internet
139.8
Verizon 5G Home Internet
101.7
Download Image
Upload Speed
in San Antonio
in Mbps
AT&T Fiber
190.8
Google Fiber
152.2
AT&T Non Fiber
123.3
T-Mobile 5G Home Internet
31.4
Spectrum
17.8
Verizon 5G Home Internet
12.5
Download Image
Video Experience
in San Antonio
in 0-100 points
Google Fiber
78.4
AT&T Fiber
78.2
Spectrum
76.8
AT&T Non Fiber
75.7
T-Mobile 5G Home Internet
75.5
Verizon 5G Home Internet
72.7
Download Image
Reliability Experience
in San Diego
100-1000 points
Spectrum
786
Cox Internet
752
AT&T Fiber
725
T-Mobile 5G Home Internet
637
Verizon 5G Home Internet
620
AT&T Non Fiber
587
Download Image
Consistent Quality
in San Diego
% of tests
Spectrum
83.9
Cox Internet
83.7
AT&T Fiber
82.6
T-Mobile 5G Home Internet
76.9
Verizon 5G Home Internet
76.4
AT&T Non Fiber
62.7
Download Image
Download Speed
in San Diego
in Mbps
AT&T Fiber
217.0
Spectrum
214.4
Cox Internet
182.0
T-Mobile 5G Home Internet
114.8
Verizon 5G Home Internet
108.3
AT&T Non Fiber
85.6
Download Image
Upload Speed
in San Diego
in Mbps
AT&T Fiber
146.5
AT&T Non Fiber
42.8
Cox Internet
36.1
T-Mobile 5G Home Internet
26.8
Spectrum
17.0
Verizon 5G Home Internet
14.7
Download Image
Video Experience
in San Diego
in 0-100 points
AT&T Fiber
77.7
Spectrum
77.6
Cox Internet
77.1
Verizon 5G Home Internet
75.9
T-Mobile 5G Home Internet
74.8
AT&T Non Fiber
74.1
Download Image
Reliability Experience
in San Francisco
100-1000 points
Sonic Fiber Internet
816
AT&T Fiber
759
Xfinity
744
Astound Broadband
704
Verizon 5G Home Internet
609
AT&T Non Fiber
580
T-Mobile 5G Home Internet
576
Download Image
Consistent Quality
in San Francisco
% of tests
Sonic Fiber Internet
87.8
Astound Broadband
85.6
Xfinity
80.9
AT&T Fiber
80.1
T-Mobile 5G Home Internet
74.4
Verizon 5G Home Internet
73.9
AT&T Non Fiber
64.5
Download Image
Download Speed
in San Francisco
in Mbps
AT&T Fiber
218.4
Sonic Fiber Internet
215.5
Xfinity
192.2
Astound Broadband
156.6
T-Mobile 5G Home Internet
113.3
AT&T Non Fiber
110.4
Verizon 5G Home Internet
102.6
Download Image
Upload Speed
in San Francisco
in Mbps
Sonic Fiber Internet
148.6
AT&T Fiber
138.0
AT&T Non Fiber
62.8
Xfinity
42.4
T-Mobile 5G Home Internet
21.4
Astound Broadband
20.0
Verizon 5G Home Internet
13.9
Download Image
Video Experience
in San Francisco
in 0-100 points
Sonic Fiber Internet
77.7
AT&T Fiber
77.2
Xfinity
76.8
Astound Broadband
75.9
Verizon 5G Home Internet
75.1
AT&T Non Fiber
74.2
T-Mobile 5G Home Internet
73.3
Download Image
Reliability Experience
in San Jose
100-1000 points
AT&T Fiber
779
Xfinity
746
Verizon 5G Home Internet
644
T-Mobile 5G Home Internet
617
AT&T Non Fiber
582
Download Image
Consistent Quality
in San Jose
% of tests
Xfinity
80.7
AT&T Fiber
79.7
Verizon 5G Home Internet
77.3
T-Mobile 5G Home Internet
76.8
AT&T Non Fiber
68.6
Download Image
Download Speed
in San Jose
in Mbps
AT&T Fiber
213.4
Xfinity
200.4
T-Mobile 5G Home Internet
129.8
AT&T Non Fiber
106.8
Verizon 5G Home Internet
85.4
Download Image
Upload Speed
in San Jose
in Mbps
AT&T Fiber
147.9
AT&T Non Fiber
60.3
Xfinity
47.7
T-Mobile 5G Home Internet
24.3
Verizon 5G Home Internet
12.9
Download Image
Video Experience
in San Jose
in 0-100 points
Xfinity
77.1
AT&T Fiber
76.5
T-Mobile 5G Home Internet
76.3
Verizon 5G Home Internet
75.1
AT&T Non Fiber
74.9
Download Image
Reliability Experience
in Seattle
100-1000 points
Ziply Fiber
793
Xfinity
763
Quantum Fiber
760
T-Mobile 5G Home Internet
669
Verizon 5G Home Internet
639
CenturyLink Internet
523
Download Image
Consistent Quality
in Seattle
% of tests
Ziply Fiber
86.7
Xfinity
82.6
Quantum Fiber
80.6
Verizon 5G Home Internet
78.8
T-Mobile 5G Home Internet
73.8
CenturyLink Internet
64.2
Download Image
Download Speed
in Seattle
in Mbps
Xfinity
215.0
Ziply Fiber
190.7
Quantum Fiber
182.3
T-Mobile 5G Home Internet
137.8
Verizon 5G Home Internet
101.7
CenturyLink Internet
68.9
Download Image
Upload Speed
in Seattle
in Mbps
Ziply Fiber
132.0
Quantum Fiber
124.3
Xfinity
45.3
CenturyLink Internet
36.0
T-Mobile 5G Home Internet
26.0
Verizon 5G Home Internet
12.6
Download Image
Video Experience
in Seattle
in 0-100 points
Ziply Fiber
77.5
Xfinity
77.2
Quantum Fiber
77.0
T-Mobile 5G Home Internet
75.8
Verizon 5G Home Internet
74.3
CenturyLink Internet
72.5
Download Image
Reliability Experience
in St. Louis
100-1000 points
AT&T Fiber
786
Spectrum
771
T-Mobile 5G Home Internet
710
AT&T Non Fiber
604
Download Image
Consistent Quality
in St. Louis
% of tests
AT&T Fiber
83.1
Spectrum
83.0
T-Mobile 5G Home Internet
76.8
AT&T Non Fiber
66.4
Download Image
Download Speed
in St. Louis
in Mbps
AT&T Fiber
250.4
Spectrum
203.5
T-Mobile 5G Home Internet
147.4
AT&T Non Fiber
135.9
Download Image
Upload Speed
in St. Louis
in Mbps
AT&T Fiber
191.1
Spectrum
115.5
AT&T Non Fiber
90.1
T-Mobile 5G Home Internet
26.5
Download Image
Video Experience
in St. Louis
in 0-100 points
AT&T Fiber
77.9
Spectrum
77.2
T-Mobile 5G Home Internet
76.0
AT&T Non Fiber
74.4
Download Image
Reliability Experience
in Tampa
100-1000 points
Spectrum
788
Frontier - Fiber
779
Frontier - Non-Fiber
745
WOW!
697
Verizon 5G Home Internet
637
T-Mobile 5G Home Internet
591
Download Image
Consistent Quality
in Tampa
% of tests
Frontier - Fiber
87.3
Spectrum
82.7
Frontier - Non-Fiber
82.4
WOW!
80.8
T-Mobile 5G Home Internet
77.4
Verizon 5G Home Internet
75.5
Download Image
Download Speed
in Tampa
in Mbps
Spectrum
239.9
Frontier - Fiber
224.7
Frontier - Non-Fiber
214.1
WOW!
165.9
T-Mobile 5G Home Internet
145.5
Verizon 5G Home Internet
132.2
Download Image
Upload Speed
in Tampa
in Mbps
Frontier - Fiber
153.7
Frontier - Non-Fiber
148.4
T-Mobile 5G Home Internet
27.7
WOW!
26.4
Spectrum
19.4
Verizon 5G Home Internet
15.5
Download Image
Video Experience
in Tampa
in 0-100 points
Frontier - Fiber
77.9
Frontier - Non-Fiber
77.1
Spectrum
77.0
WOW!
75.9
T-Mobile 5G Home Internet
75.8
Verizon 5G Home Internet
74.9
Download Image
Reliability Experience
in Virginia Beach
100-1000 points
Verizon FiOS
797
Cox Internet
737
T-Mobile 5G Home Internet
677
Verizon 5G Home Internet
636
Download Image
Consistent Quality
in Virginia Beach
% of tests
Verizon FiOS
86.9
Cox Internet
83.0
Verizon 5G Home Internet
78.2
T-Mobile 5G Home Internet
78.2
Download Image
Download Speed
in Virginia Beach
in Mbps
Verizon FiOS
248.2
Cox Internet
189.5
T-Mobile 5G Home Internet
136.6
Verizon 5G Home Internet
97.4
Download Image
Upload Speed
in Virginia Beach
in Mbps
Verizon FiOS
123.4
Cox Internet
38.6
T-Mobile 5G Home Internet
22.4
Verizon 5G Home Internet
15.7
Download Image
Video Experience
in Virginia Beach
in 0-100 points
Verizon FiOS
77.8
Cox Internet
76.5
T-Mobile 5G Home Internet
75.6
Verizon 5G Home Internet
74.3
Download Image
Reliability Experience
in Washington
100-1000 points
Verizon FiOS
811
Cox Internet
762
Xfinity
750
T-Mobile 5G Home Internet
674
Download Image
Consistent Quality
in Washington
% of tests
Verizon FiOS
87.8
Cox Internet
83.0
Xfinity
81.8
T-Mobile 5G Home Internet
77.2
Download Image
Download Speed
in Washington
in Mbps
Verizon FiOS
234.0
Cox Internet
212.2
Xfinity
200.0
T-Mobile 5G Home Internet
141.8
Download Image
Upload Speed
in Washington
in Mbps
Verizon FiOS
133.9
Xfinity
40.9
T-Mobile 5G Home Internet
28.0
Cox Internet
23.9
Download Image
Video Experience
in Washington
in 0-100 points
Verizon FiOS
77.8
Cox Internet
77.4
Xfinity
76.9
T-Mobile 5G Home Internet
75.4
Download Image

Methodology and definitions


Short single-city names have been used in the report for each MSA.

We have included all operators in markets where a specific technology (cable, fiber, copper or fixed wireless) covers a percentage of homes passed based on our proprietary service territories: 15% or more homes passed for the largest 20 MSAs; 25% or more homes passed for the largest 21-50 MSAs. We only included offerings that consumers can buy outside of a bundle. Our geography-based approach to identifying fiber vs. non-fiber isolates fiber vs. copper quite well in most cases, but in neighborhoods that were recently 100% copper and are being rapidly upgraded to fiber, they may contain some noise from fiber customers. In the case of Altice, we do not differentiate between its cable and fiber footprint because they fully overlap. All of the homes passed information comes from our 1Q25 service territories from our USA residential broadband subscriber analytics product, with fiber availability identified at the sub-census block level.

Plan characteristics — for example, speed tiers or data caps — vary greatly by provider and the dispersion of the plan mix will affect the average experience result. Opensignal’s measurements capture users’ experience, regardless of the plan that they have purchased from their provider. This report analyzes the real-world situation across all users’ plans.

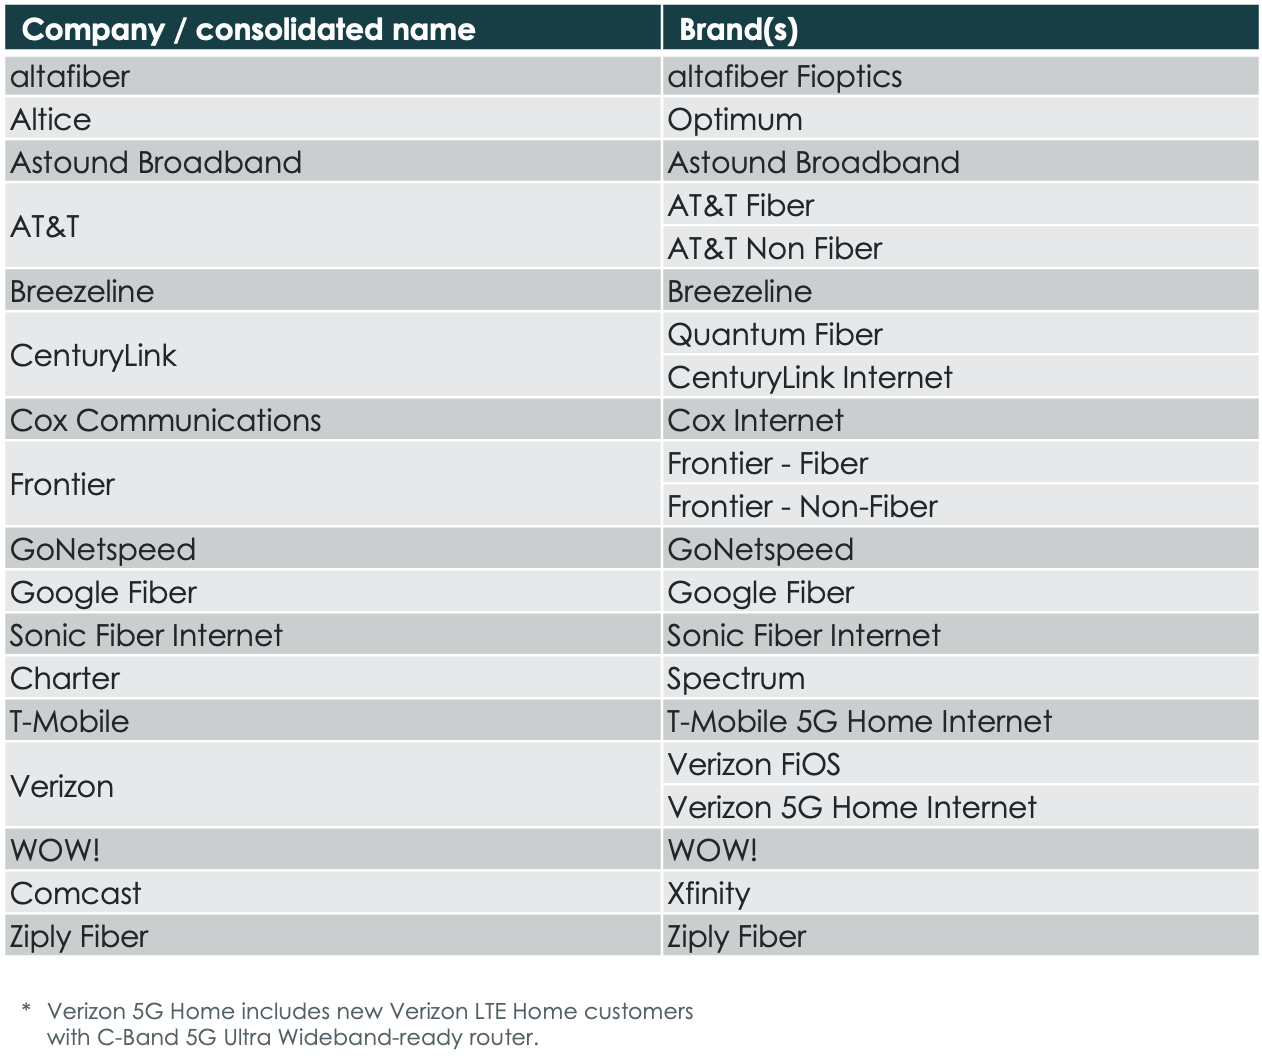
Opensignal references consumer-facing brand names in the reports. We have included a table below that outlines the parent companies associated with the consumer-facing broadband provider names.

Consistent Quality

Broadband Consistent Quality measures how often a network, from the perspective of a single device once connectivity is established, meets the requirements for common applications. Broadband Consistent Quality uses six key performance indicators: download and upload speeds, latency, jitter, packet loss, and time to first byte, setting thresholds appropriate for individual rather than multiple device usage. Metrics represent the percentage of users’ tests meeting these performance thresholds to support activities like watching HD video, completing group video calls, and gaming across all hours of the day.

Download Speed

Measured in Mbps, Broadband Download Speed represents the typical everyday speeds a user experiences across a provider’s network.

Upload Speed

Measured in Mbps, Broadband Upload Speed measures the average upload speeds for each internet service provider observed by our users across their fixed networks. Typically, upload speeds are slower than download speeds, but this often depends on the technology used for broadband connections.

Video Experience

Opensignal’s adaptive video experience quantifies the quality of video streamed to mobile devices by measuring real-world video streams over an operator's network. The metric measures users’ adaptive video experience using a Mean Opinion Score (MOS) approach inspired by International Telecommunication Union (ITU) studies which have derived a relationship between technical parameters of adaptive bitrate video streaming and the perceived video experience as reported by real people.

The videos tested are streamed directly from the world’s largest video content providers and include a wide selection of resolutions that dynamically match the network conditions, available bandwidth and device performance. Resolutions range from 144p to 2160p, which is also called 4K or UHD (Ultra High Definition). The model calculates a MOS score on a 0 to 100 scale by evaluating a number of parameters, including: the time to start playing the video, the quality of the video, the time playing each resolution, and the time spent re-buffering.

Reliability Experience

Opensignal’s Broadband Reliability Experience metric measures the entire user experience, from establishing a connection to successfully completing tasks like streaming video, browsing the web, and scrolling through social media. It captures the true end-to-end reliability experience by analyzing the two most popular internet protocols -— TCP (transmission control protocol) and UDP (user datagram protocol) — for a comprehensive measure of every aspect of households' experience with their ISP’s network. We can assess when things are working flawlessly, when something is erratic, and when there is no connection at all. Calculated on a scale of 100-1000, with higher scores indicating better Reliability Experience, the metric consists of three main components:

  • Connectivity: Measuring the household's ability to connect to the internet. While ISPs strive to provide ubiquitous connectivity there are often events that lead to outages, and the connectivity component of the score captures the proportion of times when households don’t have internet access.

  • Completion: Completion measures the ability to complete typical tasks. It ensures that the established connection is maintained and there is a consistent flow of information as consumers would expect.

  • Sufficiency: Ensures that the task is performed sufficiently well. This component includes speed thresholds, latency thresholds, jitter, and other technical components that are prerequisites for good service and application experiences.

Related Analysis

Our Methodology

Collecting billions of individual measurements daily from over 100 million devices globally, Opensignal independently analyzes mobile and broadband user experience on every major network operator around the globe.

About Opensignal

Opensignal is the leading global provider of independent insights into consumers' connectivity experiences and choice of carrier. Our proprietary insights into mobile and broadband networks give operators the solutions they need to profitably compete and win, from executive level scorecards and public validation to pin-point level engineering analytics and consumer decision dynamics.

Check how your internet connection impacts your favorite apps with the Meteor App