


USA
Opensignal is the independent global standard for analyzing consumers' connectivity experiences. Our industry reports are the definitive guide to understanding what happens when people use their mobile and broadband connections in their daily life.
USA
Opensignal is the independent global standard for analyzing consumers' connectivity experiences. Our industry reports are the definitive guide to understanding what happens when people use their mobile and broadband connections in their daily life.

Key Findings
National
Xfinity wins three of the five national awards
Xfinity leads for Consistent Quality, Download Speed and Video – beating out second-placed Verizon for Consistent Quality, and Spectrum for both Download Speed and Video. Video experience is particularly close between all operators, with all five ISPs placing in the ‘Very Good’ category. This means our users were, on average, able to stream video at 1080p or better with satisfactory loading times and little stalling.
Our users on Spectrum experience the best Reliability
Spectrum takes the top spot in our Reliability metric with a score of 761 on a 100-1000 point scale. Here, Xfinity places second at 748. All the operators achieve results over 600. Based on an Opensignal study, users who rate their home Internet as highly reliable typically have experienced reliability scores 600 and above. That means the connection has either never dropped or dropped very infrequently and service has been sufficient for usual activities almost all the time.
AT&T excels for Upload Speed
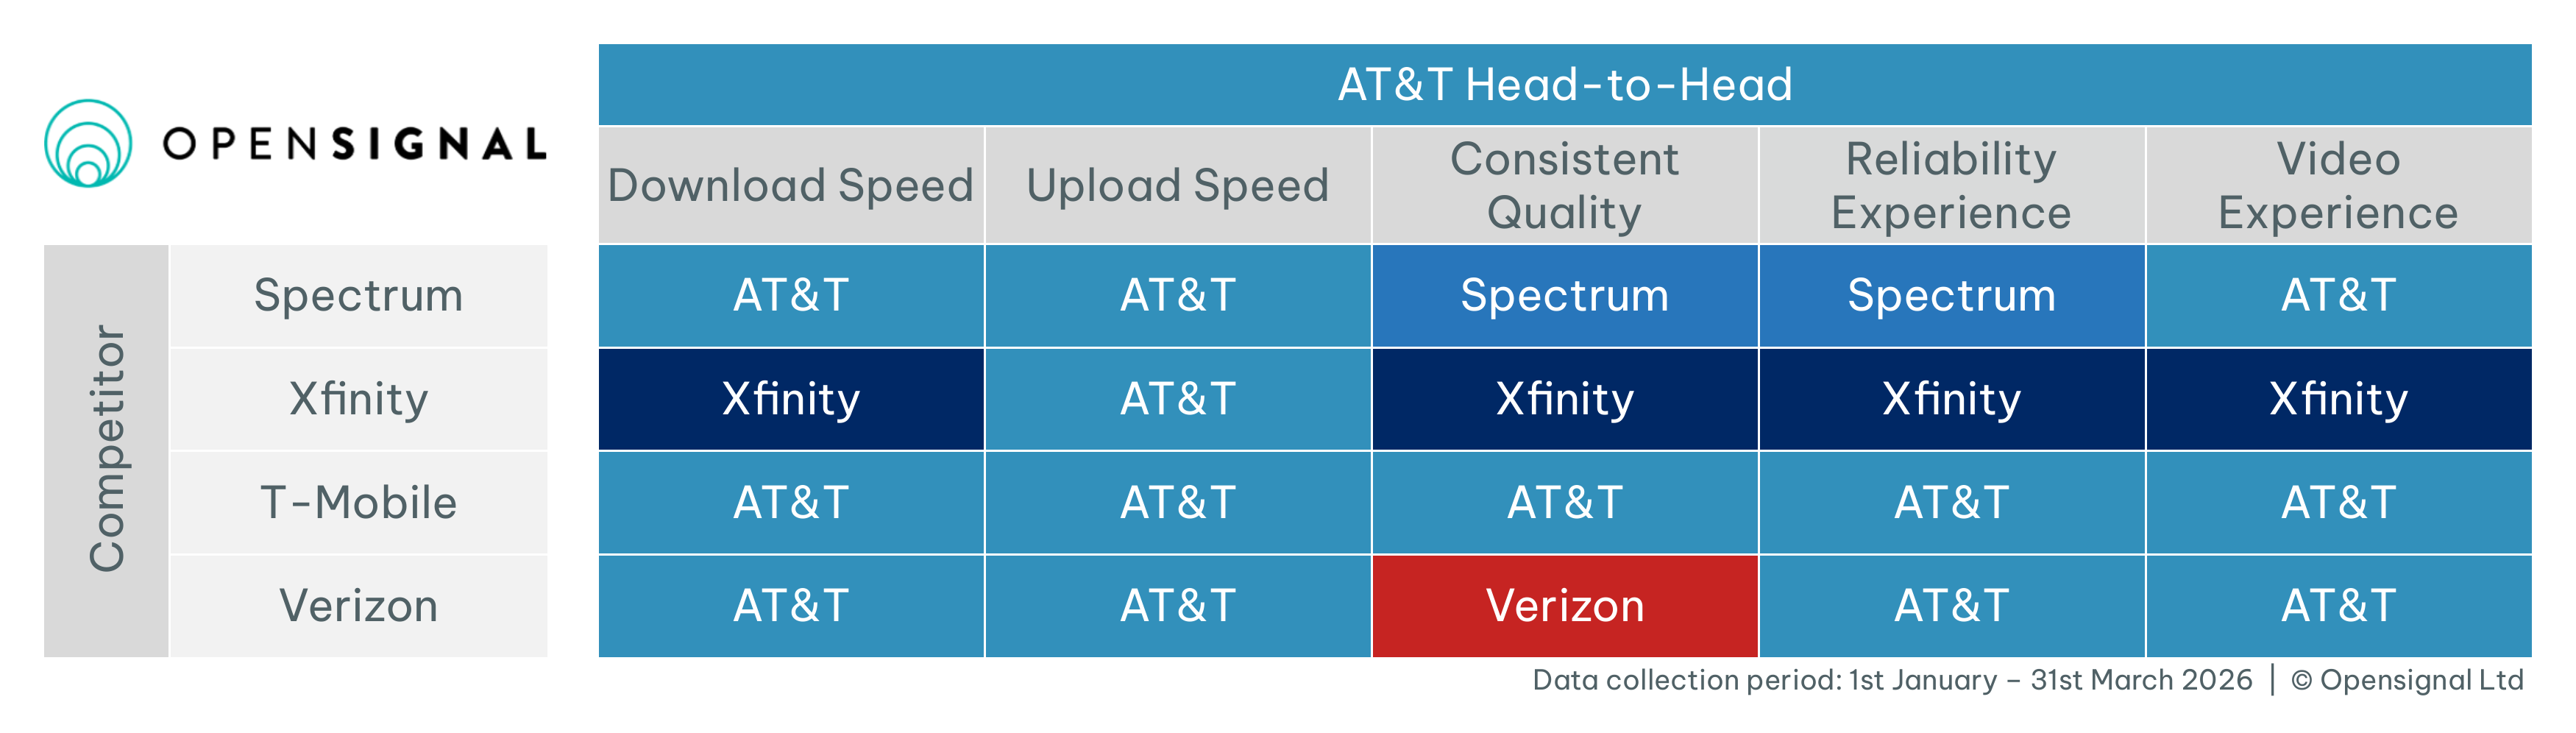
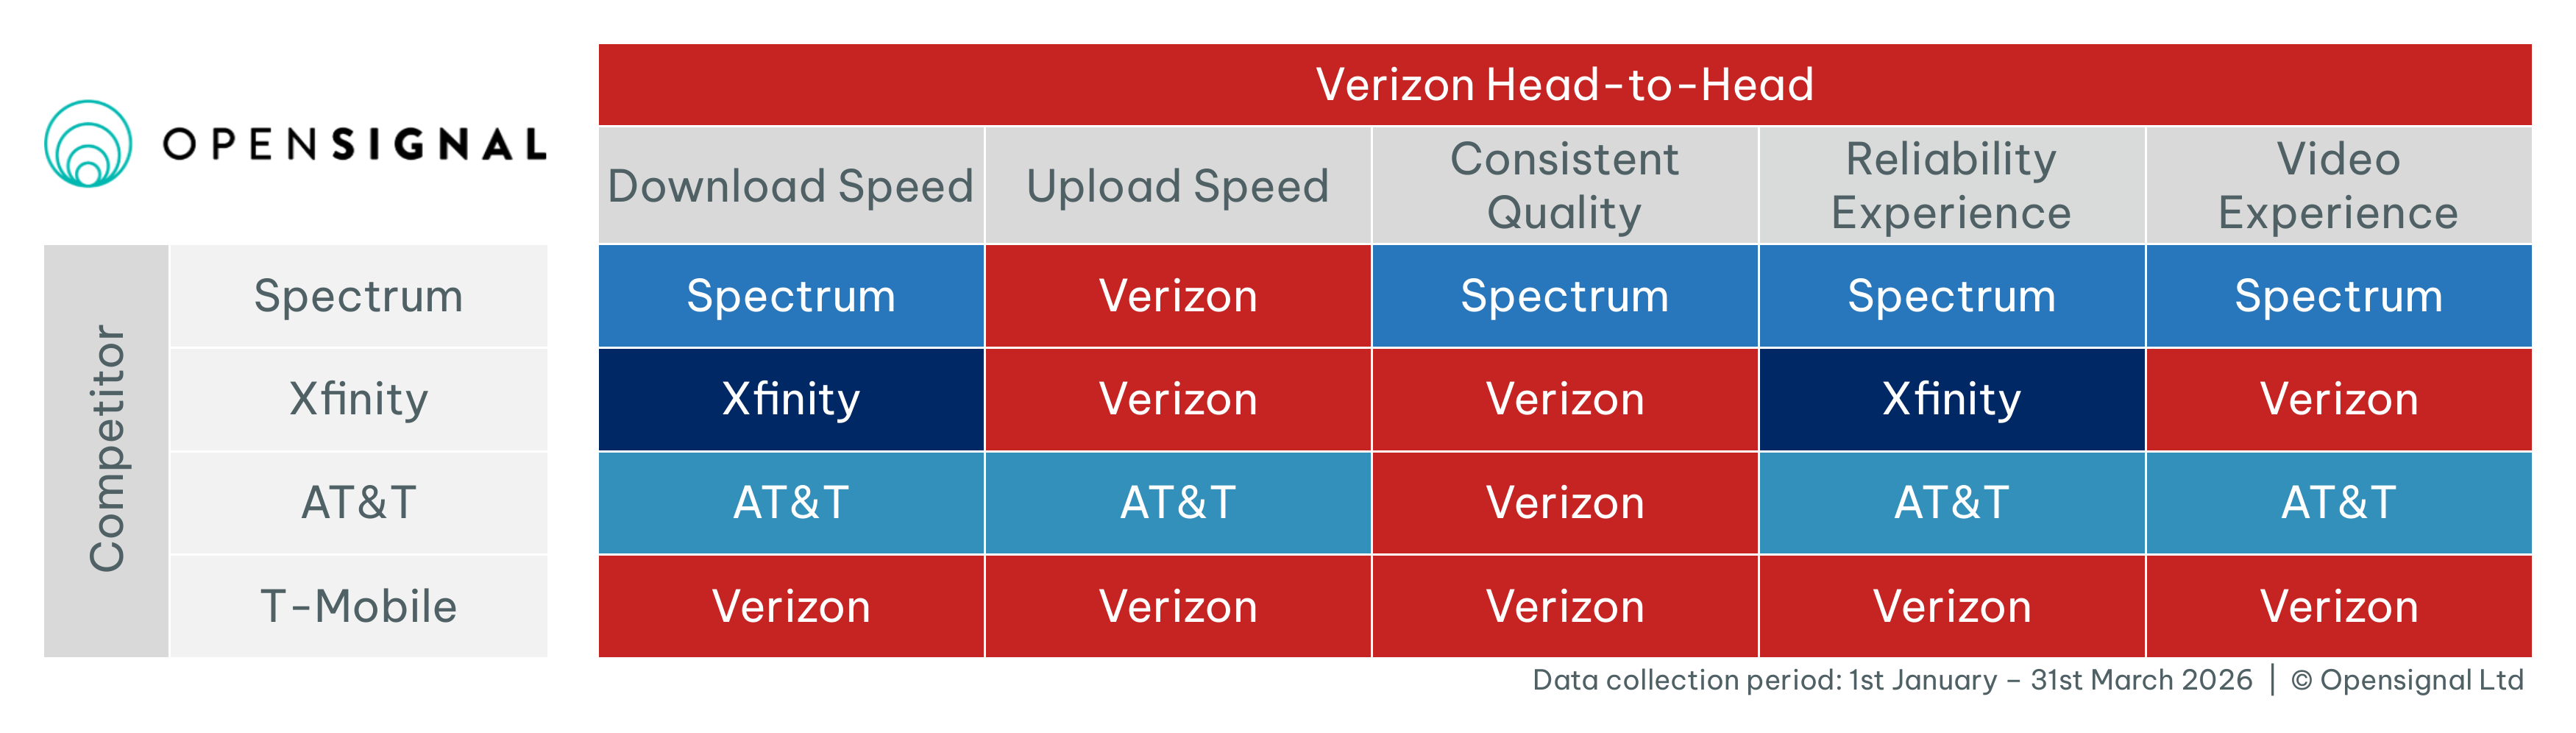
AT&T’s upload speed result of 120.0Mbps is over double that of second-placed Verizon (58.0Mbps). This result comes from the high performance of AT&T’s fiber infrastructure. It also achieves a clean sweep on this metric in each of its head-to-head comparisons.
Verizon performs well for Consistent Quality in its head-to-head comparisons
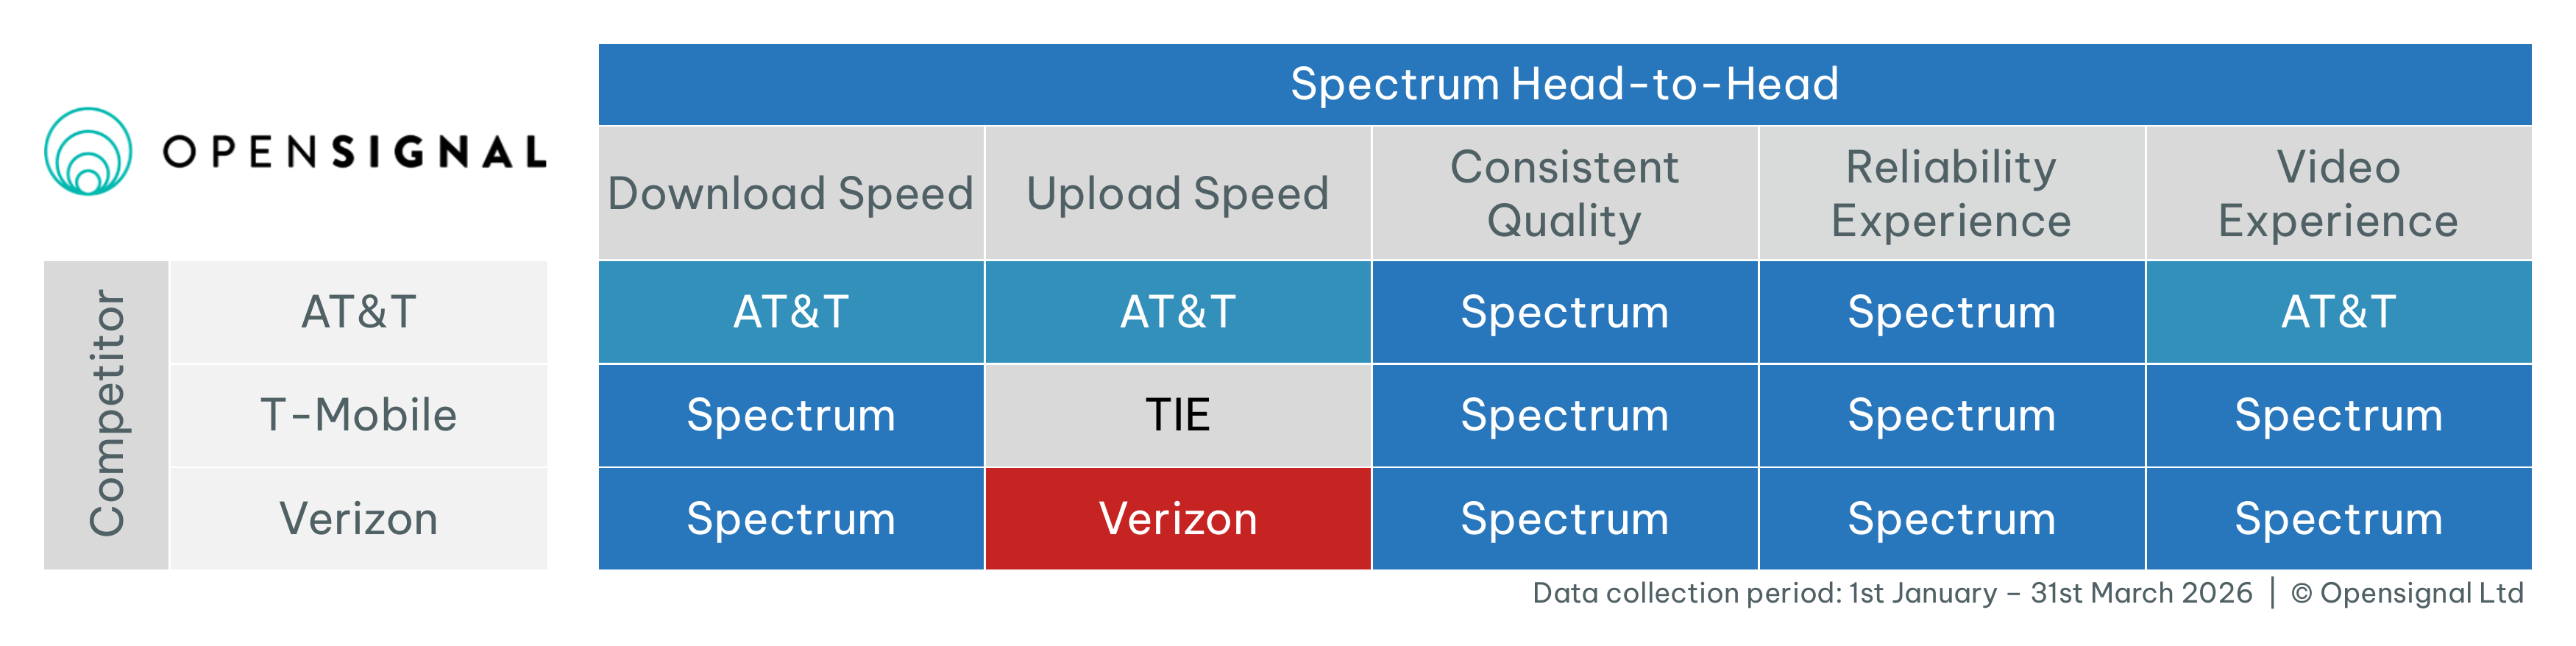
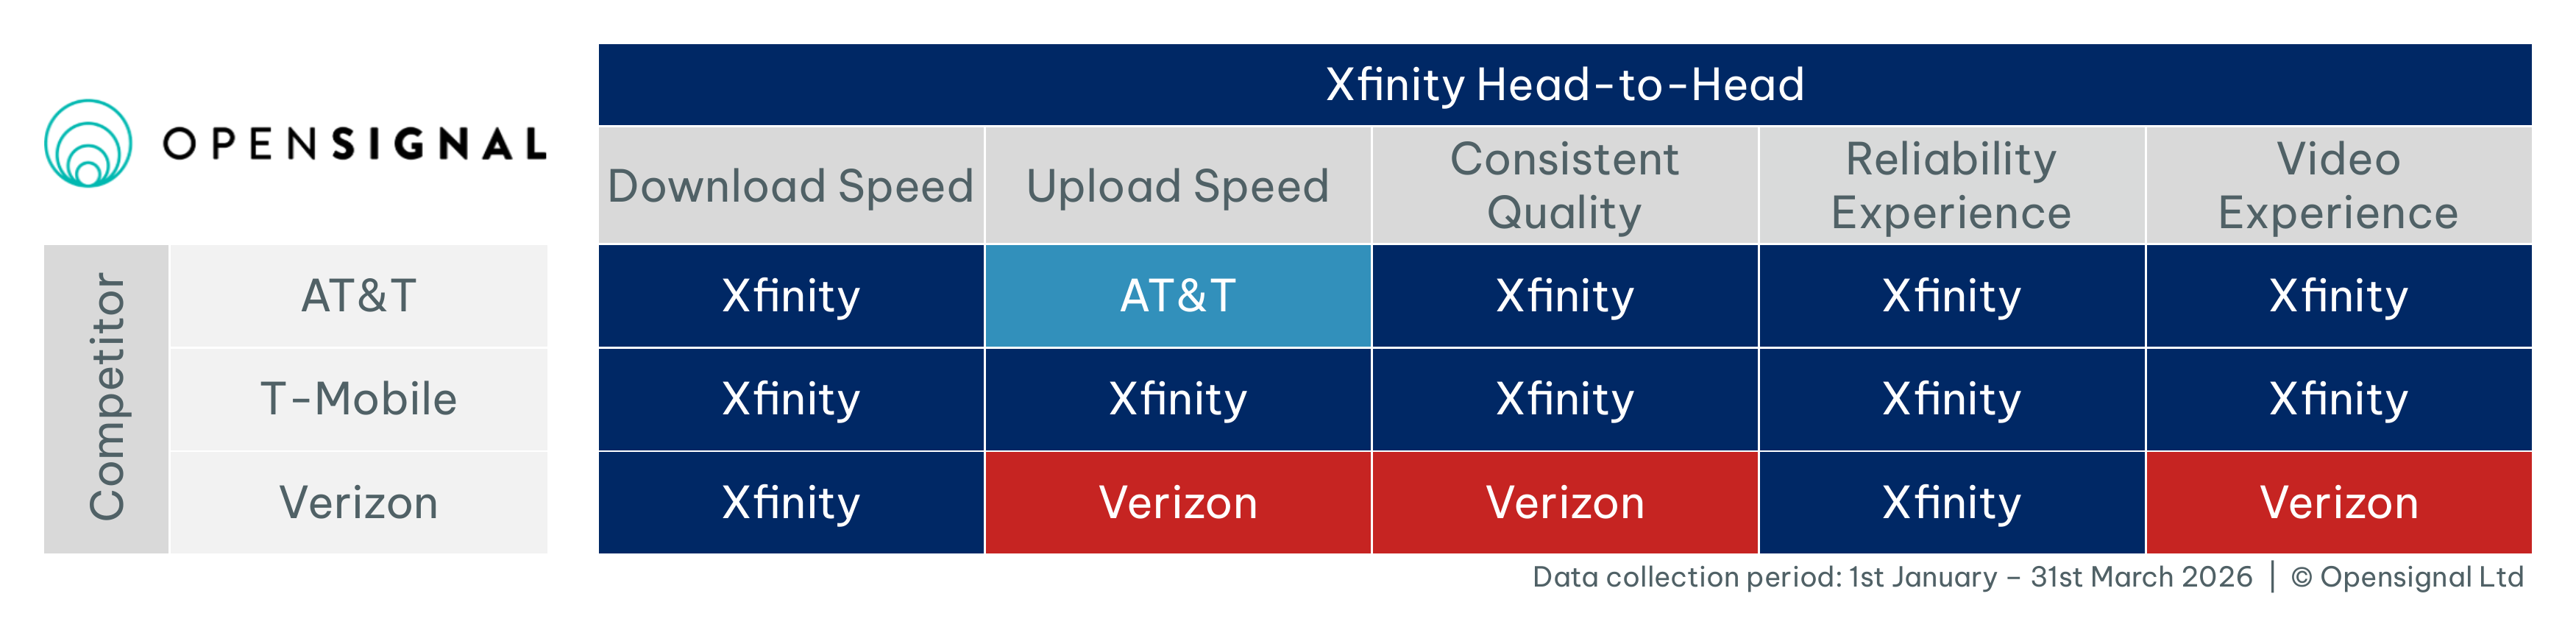
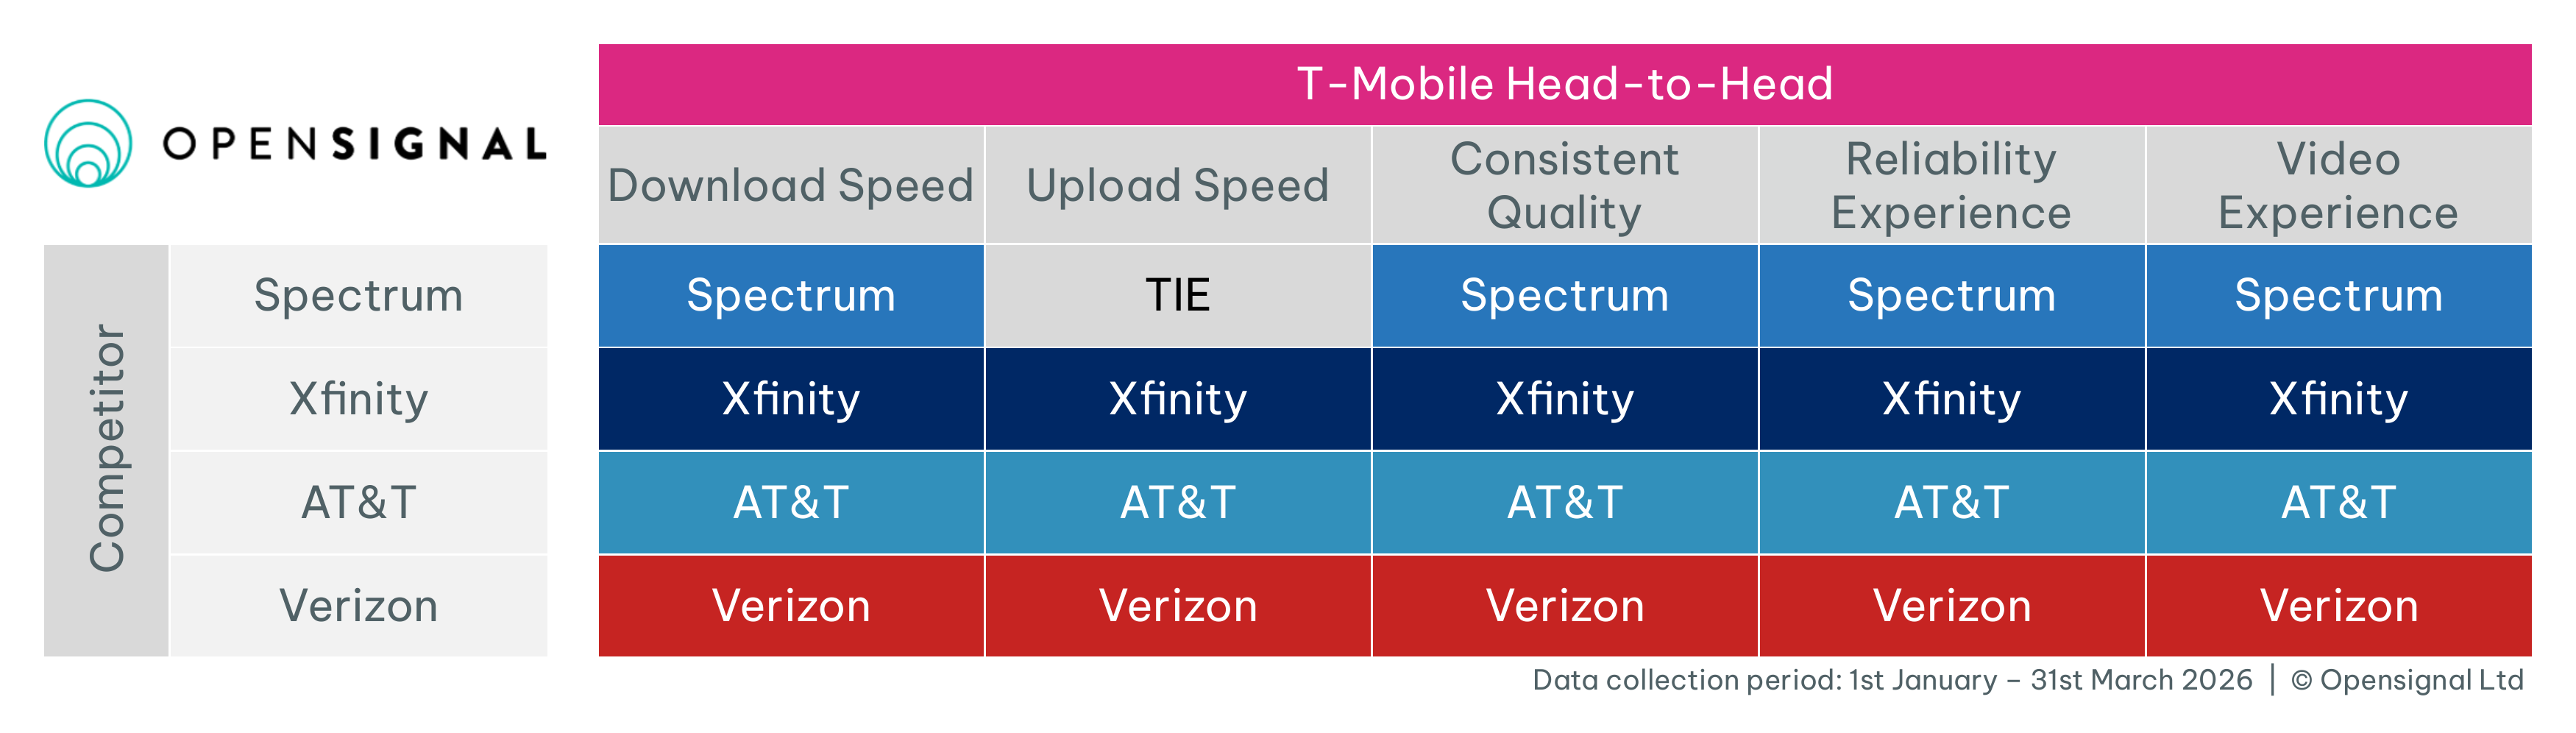
While Verizon places a close second nationally for Consistent Quality, it takes the top spot in its head-to-head comparisons for this metric with Xfinity, AT&T and T-Mobile.
Operator strategies deliver ongoing improvements
All operators show improvement across the majority of metrics compared to last year’s report. Both cable providers (Xfinity and Spectrum) show significant increases in upload speed of 20% and 36% respectively as they deploy later versions of DOCSIS, meanwhile AT&T sees higher performance across all metrics from its widening fiber footprint. T-Mobile also sees a 58-point improvement in Reliability compared to last year, showing the strength of its fixed wireless access (FWA) service, even as it continues to attract large numbers of net additions each quarter.
National Fixed Broadband Experience


Overall Experience





Definitions
Opensignal's Broadband Reliability Experience measures the ability of a household to connect to the internet and to successfully complete 'uninterrupted' tasks across multiple devices, encompassing work and recreational activities. While Reliability incorporates and expands upon elements akin to Broadband Consistent Quality, it uniquely includes assessments of initial connectivity and continuous completion of tasks, making it more comprehensive in scenarios involving multiple simultaneous connections.
Definitions
Broadband Consistent Quality measures how often a network, from the perspective of a single device once connectivity is established, meets the requirements for common applications. Broadband Consistent Quality uses six key performance indicators: download and upload speeds, latency, jitter, packet loss, and time to first byte, setting thresholds appropriate for individual rather than multiple device usage. Metrics represent the percentage of users’ tests meeting these performance thresholds to support activities like watching HD video, completing group video calls, and gaming across all hours of the day.
Definitions
Measured in Mbps, Broadband Download Speed represents the typical everyday speeds a user experiences across a provider’s network.
Definitions
Measured in Mbps, Broadband Upload Speed measures the average upload speeds for each internet service provider observed by our users across their fixed networks. Typically, upload speeds are slower than download speeds, but this often depends on the technology used for broadband connections.
Definitions
Opensignal’s adaptive video experience quantifies the quality of video streamed to mobile devices by measuring real-world video streams over an operator's network. The metric measures users’ adaptive video experience using a Mean Opinion Score (MOS) approach inspired by International Telecommunication Union (ITU) studies which have derived a relationship between technical parameters of adaptive bitrate video streaming and the perceived video experience as reported by real people.
The videos tested are streamed directly from the world’s largest video content providers and include a wide selection of resolutions that dynamically match the network conditions, available bandwidth and device performance. Resolutions range from 144p to 2160p, which is also called 4K or UHD (Ultra High Definition). The model calculates a MOS score on a 0 to 100 scale by evaluating a number of parameters, including: the time to start playing the video, the quality of the video, the time playing each resolution, and the time spent re-buffering.
Market Overview
This report is the first in a two-part series on U.S. fixed broadband experience. In this part, we will cover the national fixed broadband landscape, while the second part covers experience in the largest 50 Metropolitan Statistical Areas.
News in the U.S. fixed broadband space centers on two key themes: consolidation, and network expansion – both in terms of additional homes passed, and improved network capabilities.
This is most evident among the telcos, where operators are using acquisitions to accelerate fiber footprint growth. T-Mobile’s expansion in particular illustrates this approach. FWA remains its primary source of net additions according to Opensignal subscriber analytics, while its acquisitions of Lumos and Metronet represent the majority of its fiber subscribers. Its planned acquisitions of i3 Broadband, GoNetspeed and Greenlight Networks therefore represent a continuation of this strategy: using regional providers to scale its footprint.
A similar pattern is visible across the other national operators. Verizon’s acquisitions of Frontier and Starry expand its fiber footprint and FWA capabilities respectively, while AT&T’s purchase of Lumen’s fiber assets and EchoStar spectrum for FWA echo the same approach. The merger of Google Fiber and Astound suggests this consolidation is not limited to national operators, but reflects broader pressure for providers of all sizes to scale. This also extends to cablecos, where the FCC has now greenlit Charter’s merger with Cox. The deal is due to complete later in 2026.
Alongside acquisitions, AT&T’s $250 billion investment plan highlights the continued importance of organic network expansion. Its strategy combines fiber deployment with the gradual shutdown of legacy copper infrastructure, using FWA as a fallback in areas where fiber economics are less favorable. This points to a hybrid approach, where cost and coverage constraints determine which technologies operators deploy.
Network investment is also the focus for the cablecos, Comcast and Charter, specifically on the move to DOCSIS 4.0. Comcast’s DOCSIS 4.0 deployment, now reaching millions of homes, and Charter’s positioning of DOCSIS 4.0 as a core part of its growth strategy, both reflect an effort to increase network performance, in particular around upload. For consumers, this allows cable networks to deliver more symmetrical speeds, narrowing the upload performance gap with fiber.
In this report, we focus on the five Internet Service Providers (ISPs) in the U.S. with the most extensive service areas: AT&T, Spectrum (Charter), T-Mobile, Verizon, and Xfinity (Comcast). All award tables are technology-agnostic and include a blend of different types of ISP technology access (cable, DSL, FWA, and fiber). At this stage, Charter’s results do not include Cox data, Verizon’s results do not include Frontier, and T-Mobile’s results do not include T-Fiber.
We also conduct five head-to-head comparisons between the analyzed ISPs by looking at how each broadband provider compares against its direct competitors based on the extent of the overlap of each provider’s service area. Overlaps are based on Q1 2026 Opensignal service territories.
Head-to-Head Fixed Broadband Experience
These five head-to-head comparisons between the analyzed ISPs look at how each broadband provider compares against its direct competitors based on the extent of the overlap of each provider’s service area. Overlaps are based on Q1 2026 Opensignal service territories.
Related Analysis
Our Methodology
Collecting billions of individual measurements daily from over 100 million devices globally, Opensignal independently analyzes mobile and broadband user experience on every major network operator around the globe.
About Opensignal
Opensignal is the leading global provider of independent insights into consumers' connectivity experiences and choice of carrier. Our proprietary insights into mobile and broadband networks give operators the solutions they need to profitably compete and win, from executive level scorecards and public validation to pin-point level engineering analytics and consumer decision dynamics.
Check how your internet connection impacts your favorite apps with the Meteor App



Journalists, please retain the Opensignal logo and copyright
(© Opensignal Limited) information when using this image.
This image may not be used for any commercial purpose, including use in advertisements or other promotional content, without prior written consent.
Confidence Intervals
For every metric we calculate statistical confidence intervals indicated on our graphs. When confidence intervals overlap, our measured results are too close to declare a winner. In those cases, we show a statistical draw. For this reason, some metrics have multiple operator winners.
In our bar graphs we represent confidence intervals as boundaries on either sides of graph bars.
In our supporting-metric charts we show confidence intervals as +/- numerical values.
Why confidence intervals are vital in analyzing mobile network experience