


USA
Opensignal is the independent global standard for analyzing consumers' connectivity experiences. Our industry reports are the definitive guide to understanding what happens when people use their mobile and broadband connections in their daily life.
USA
Opensignal is the independent global standard for analyzing consumers' connectivity experiences. Our industry reports are the definitive guide to understanding what happens when people use their mobile and broadband connections in their daily life.

USA Fixed Broadband Experience — MSA View
Key Findings
AT&T - Fiber shows both scale and strength, with the greatest number of wins
AT&T's fiber achieves 107 wins, either outright or jointly, across the 26 different MSAs where it qualifies for inclusion. This includes 16 MSAs where AT&T's fiber wins all five categories (either outright or jointly). These wins are also spread across all metrics categories, with 24 wins for Download, 24 for Upload, 23 for Video Experience, 19 for Reliability and 17 for Consistent Quality, demonstrating that AT&T - Fiber’s strengths are not limited to just one facet of its performance.
Verizon - Fiber excels in all MSAs where it is included
In the markets where Verizon's fiber meets our inclusion criteria, it performs exceptionally. It wins (jointly or individually) across all five categories in each of the nine MSAs where it is included, primarily in the Northeastern United States. This brings its award total to 45.
Regional fiber providers deliver strong local performances
GFiber wins or co-wins 23 awards across five MSAs, including achieving joint or outright wins in all five categories in Austin, Raleigh, Salt Lake City and San Antonio. Frontier's fiber network achieves 19 joint or outright wins, with its strongest performance (five wins apiece) in Tampa and Riverside. Ziply Fiber achieves eight awards across Portland and Seattle, Meanwhile Sonic wins all five awards (three outright) in San Francisco. and Ezee Fiber sweeps Houston (also with three outright and two joint wins).
Cable performance is competitive in specific markets
Cable operators remain competitive at the MSA level, with both Xfinity and Spectrum recording multiple joint or outright wins across the 50 markets. Xfinity achieves 29 awards spanning 10 of the 28 MSAs where we have reported results. This includes strong performances, winning jointly or outright in all five categories, in Sacramento and Fresno. Spectrum’s results are more concentrated, with awards in six MSAs out of the 22 where it is included. Its strongest showing is in Grand Rapids, where it wins, jointly or outright, in four categories (Reliability, Download Speed, Consistent Quality and Video).
Overall Experience
Regional Fixed Broadband Experience

-
A-D
- Atlanta
- Austin
- Baltimore
- Birmingham
- Boston
- Charlotte
- Chicago
- Cincinnati
- Cleveland
- Columbus
- Dallas
- Denver
- Detroit
-
E-H
- Fresno
- Grand Rapids
- Hartford
- Houston
-
I-L
- Indianapolis
- Jacksonville
- Kansas City
- Las Vegas
- Los Angeles
- Louisville
-
M-P
- Memphis
- Miami
- Milwaukee
- Minneapolis
- Nashville
- New York
- Oklahoma
- Orlando
- Philadelphia
- Phoenix
- Pittsburgh
- Portland
- Providence
-
Q-T
- Raleigh
- Richmond
- Riverside
- Sacramento
- Salt Lake City
- San Antonio
- San Diego
- San Francisco
- San Jose
- Seattle
- St. Louis
- Tampa
-
U-X
- Virginia Beach
- Washington
in Atlanta


in Atlanta
in Atlanta
in Atlanta
in Atlanta
in Austin
in Austin
in Austin
in Austin

in Austin
in Baltimore
in Baltimore
in Baltimore
in Baltimore
in Baltimore
in Birmingham
in Birmingham
in Birmingham
in Birmingham
in Birmingham
in Boston
in Boston
in Boston
in Boston
in Boston
in Charlotte
in Charlotte
in Charlotte
in Charlotte
in Charlotte
in Chicago
in Chicago
in Chicago
in Chicago
in Chicago
in Cincinnati
in Cincinnati
in Cincinnati
in Cincinnati
in Cincinnati
in Cleveland
in Cleveland
in Cleveland
in Cleveland
in Cleveland
in Columbus
in Columbus
in Columbus
in Columbus
in Columbus
in Dallas
in Dallas
in Dallas
in Dallas
in Dallas
in Denver
in Denver
in Denver
in Denver
in Denver
in Detroit
in Detroit
in Detroit
in Detroit
in Detroit
in Fresno
in Fresno
in Fresno
in Fresno
in Fresno
in Grand Rapids
in Grand Rapids
in Grand Rapids
in Grand Rapids
in Grand Rapids
in Hartford
in Hartford
in Hartford
in Hartford
in Hartford
in Houston
in Houston
in Houston
in Houston
in Houston
in Indianapolis
in Indianapolis
in Indianapolis
in Indianapolis
in Indianapolis
in Jacksonville
in Jacksonville
in Jacksonville
in Jacksonville
in Jacksonville
in Kansas City
in Kansas City
in Kansas City
in Kansas City
in Kansas City
in Las Vegas
in Las Vegas
in Las Vegas
in Las Vegas
in Las Vegas
in Los Angeles
in Los Angeles
in Los Angeles
in Los Angeles
in Los Angeles
in Louisville
in Louisville
in Louisville
in Louisville
in Louisville
in Memphis
in Memphis
in Memphis
in Memphis
in Memphis
in Miami
in Miami
in Miami
in Miami
in Miami
in Milwaukee
in Milwaukee
in Milwaukee
in Milwaukee
in Milwaukee
in Minneapolis
in Minneapolis
in Minneapolis
in Minneapolis
in Minneapolis
in Nashville
in Nashville
in Nashville
in Nashville
in Nashville
in New York
in New York
in New York
in New York
in New York
in Oklahoma
in Oklahoma
in Oklahoma
in Oklahoma
in Oklahoma
in Orlando
in Orlando
in Orlando
in Orlando
in Orlando
in Philadelphia
in Philadelphia
in Philadelphia
in Philadelphia
in Philadelphia
in Phoenix
in Phoenix
in Phoenix
in Phoenix
in Phoenix
in Pittsburgh
in Pittsburgh
in Pittsburgh
in Pittsburgh
in Pittsburgh
in Portland
in Portland
in Portland
in Portland
in Portland
in Providence
in Providence
in Providence
in Providence
in Providence
in Raleigh
in Raleigh
in Raleigh
in Raleigh
in Raleigh
in Richmond
in Richmond
in Richmond
in Richmond
in Richmond
in Riverside
in Riverside
in Riverside
in Riverside
in Riverside
in Sacramento
in Sacramento
in Sacramento
in Sacramento
in Sacramento
in Salt Lake City
in Salt Lake City
in Salt Lake City
in Salt Lake City
in Salt Lake City
in San Antonio
in San Antonio
in San Antonio
in San Antonio
in San Antonio
in San Diego
in San Diego
in San Diego
in San Diego
in San Diego
in San Francisco
in San Francisco
in San Francisco
in San Francisco
in San Francisco
in San Jose
in San Jose
in San Jose
in San Jose
in San Jose
in Seattle
in Seattle
in Seattle
in Seattle
in Seattle
in St. Louis
in St. Louis
in St. Louis
in St. Louis
in St. Louis
in Tampa
in Tampa
in Tampa
in Tampa
in Tampa
in Virginia Beach
in Virginia Beach
in Virginia Beach
in Virginia Beach
in Virginia Beach
in Washington
in Washington
in Washington
in Washington
in Washington
Methodology
Short single-city names have been used in the report for each MSA.
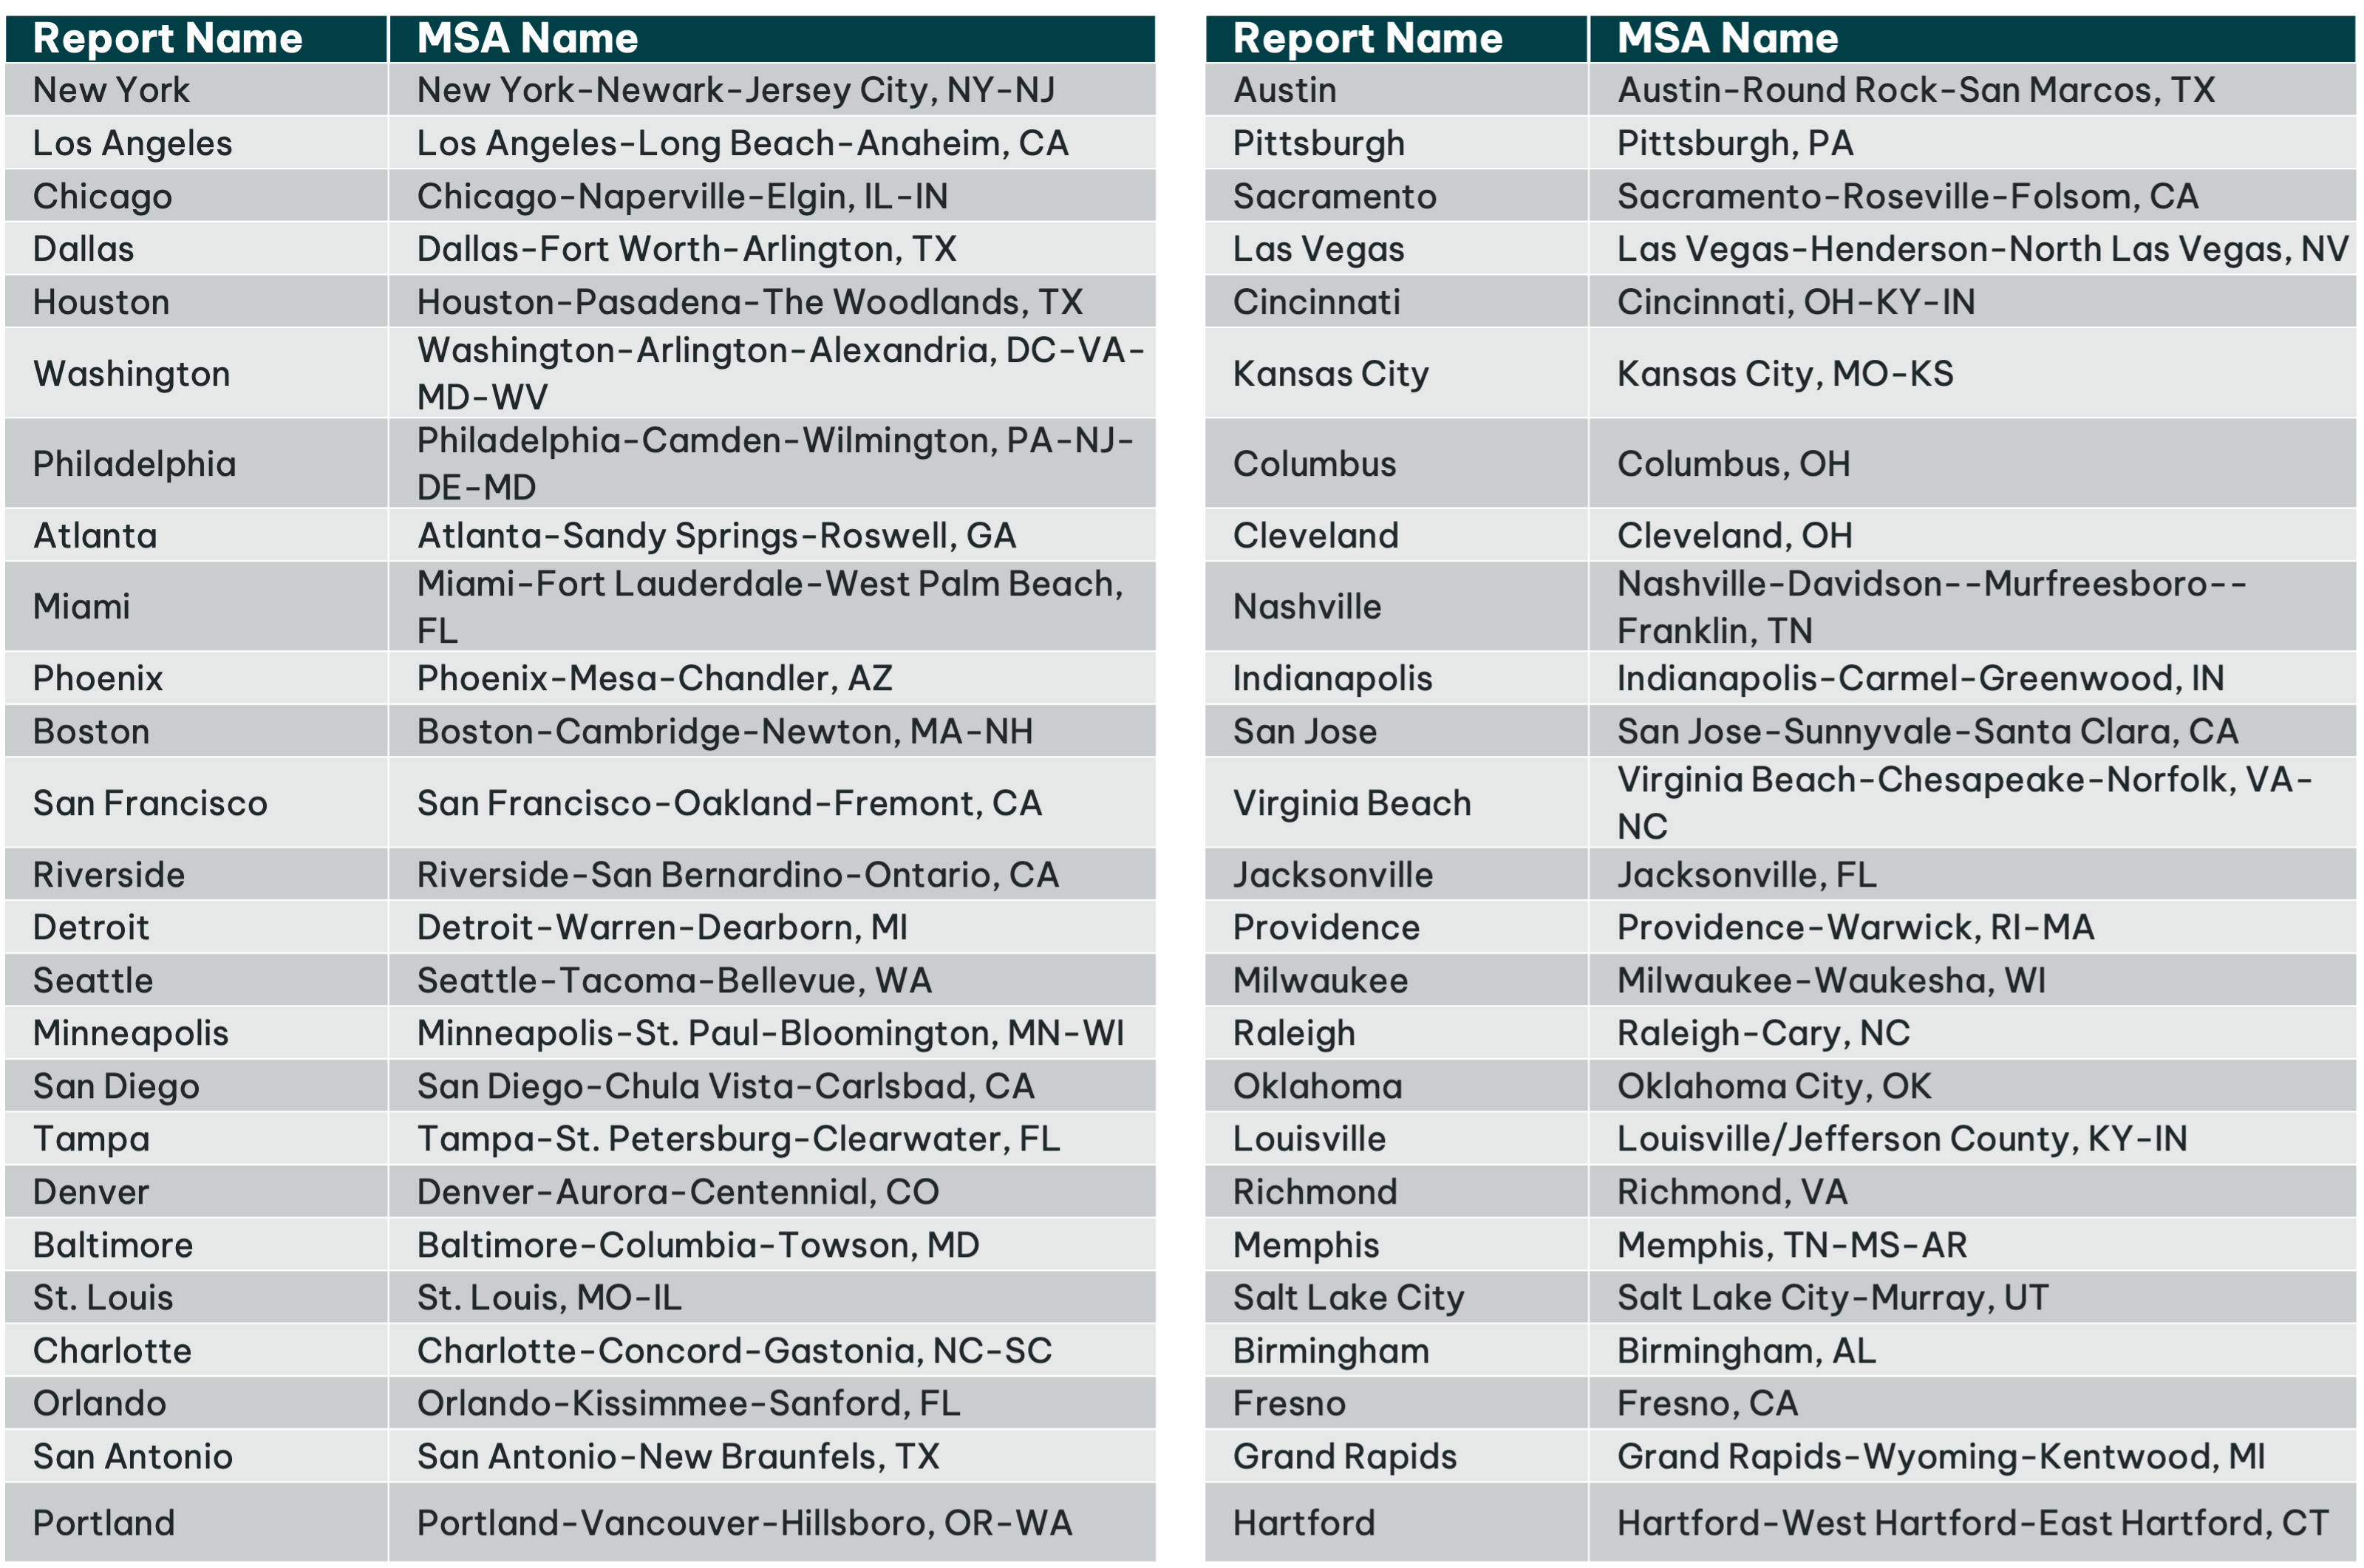
We have included all operators in markets where a specific technology (cable, fiber, copper or fixed wireless) covers a percentage of homes passed based on our proprietary service territories: 15% or more homes passed for the largest 20 MSAs; 25% or more homes passed for the largest 21-50 MSAs. We only included offerings that consumers can buy outside of a bundle. Where an operator offers both fiber and copper in a market, we have included only its fiber performance. Our geography-based approach to identifying fiber vs. non-fiber isolates fiber vs. copper quite well in most cases, but in neighborhoods that were recently 100% copper and are being rapidly upgraded to fiber, they may contain some noise from fiber customers. In the case of Altice, we do not differentiate between its cable and fiber footprint because they fully overlap. All of the homes passed information comes from our 4Q25 service territories from our USA residential broadband subscriber analytics product, with fiber availability identified at the sub-census block level.
Plan characteristics — for example, speed tiers or data caps — vary greatly by provider and the dispersion of the plan mix will affect the average experience result. Opensignal’s measurements capture users’ experience, regardless of the plan that they have purchased from their provider. This report analyzes the real-world situation across all users’ plans.
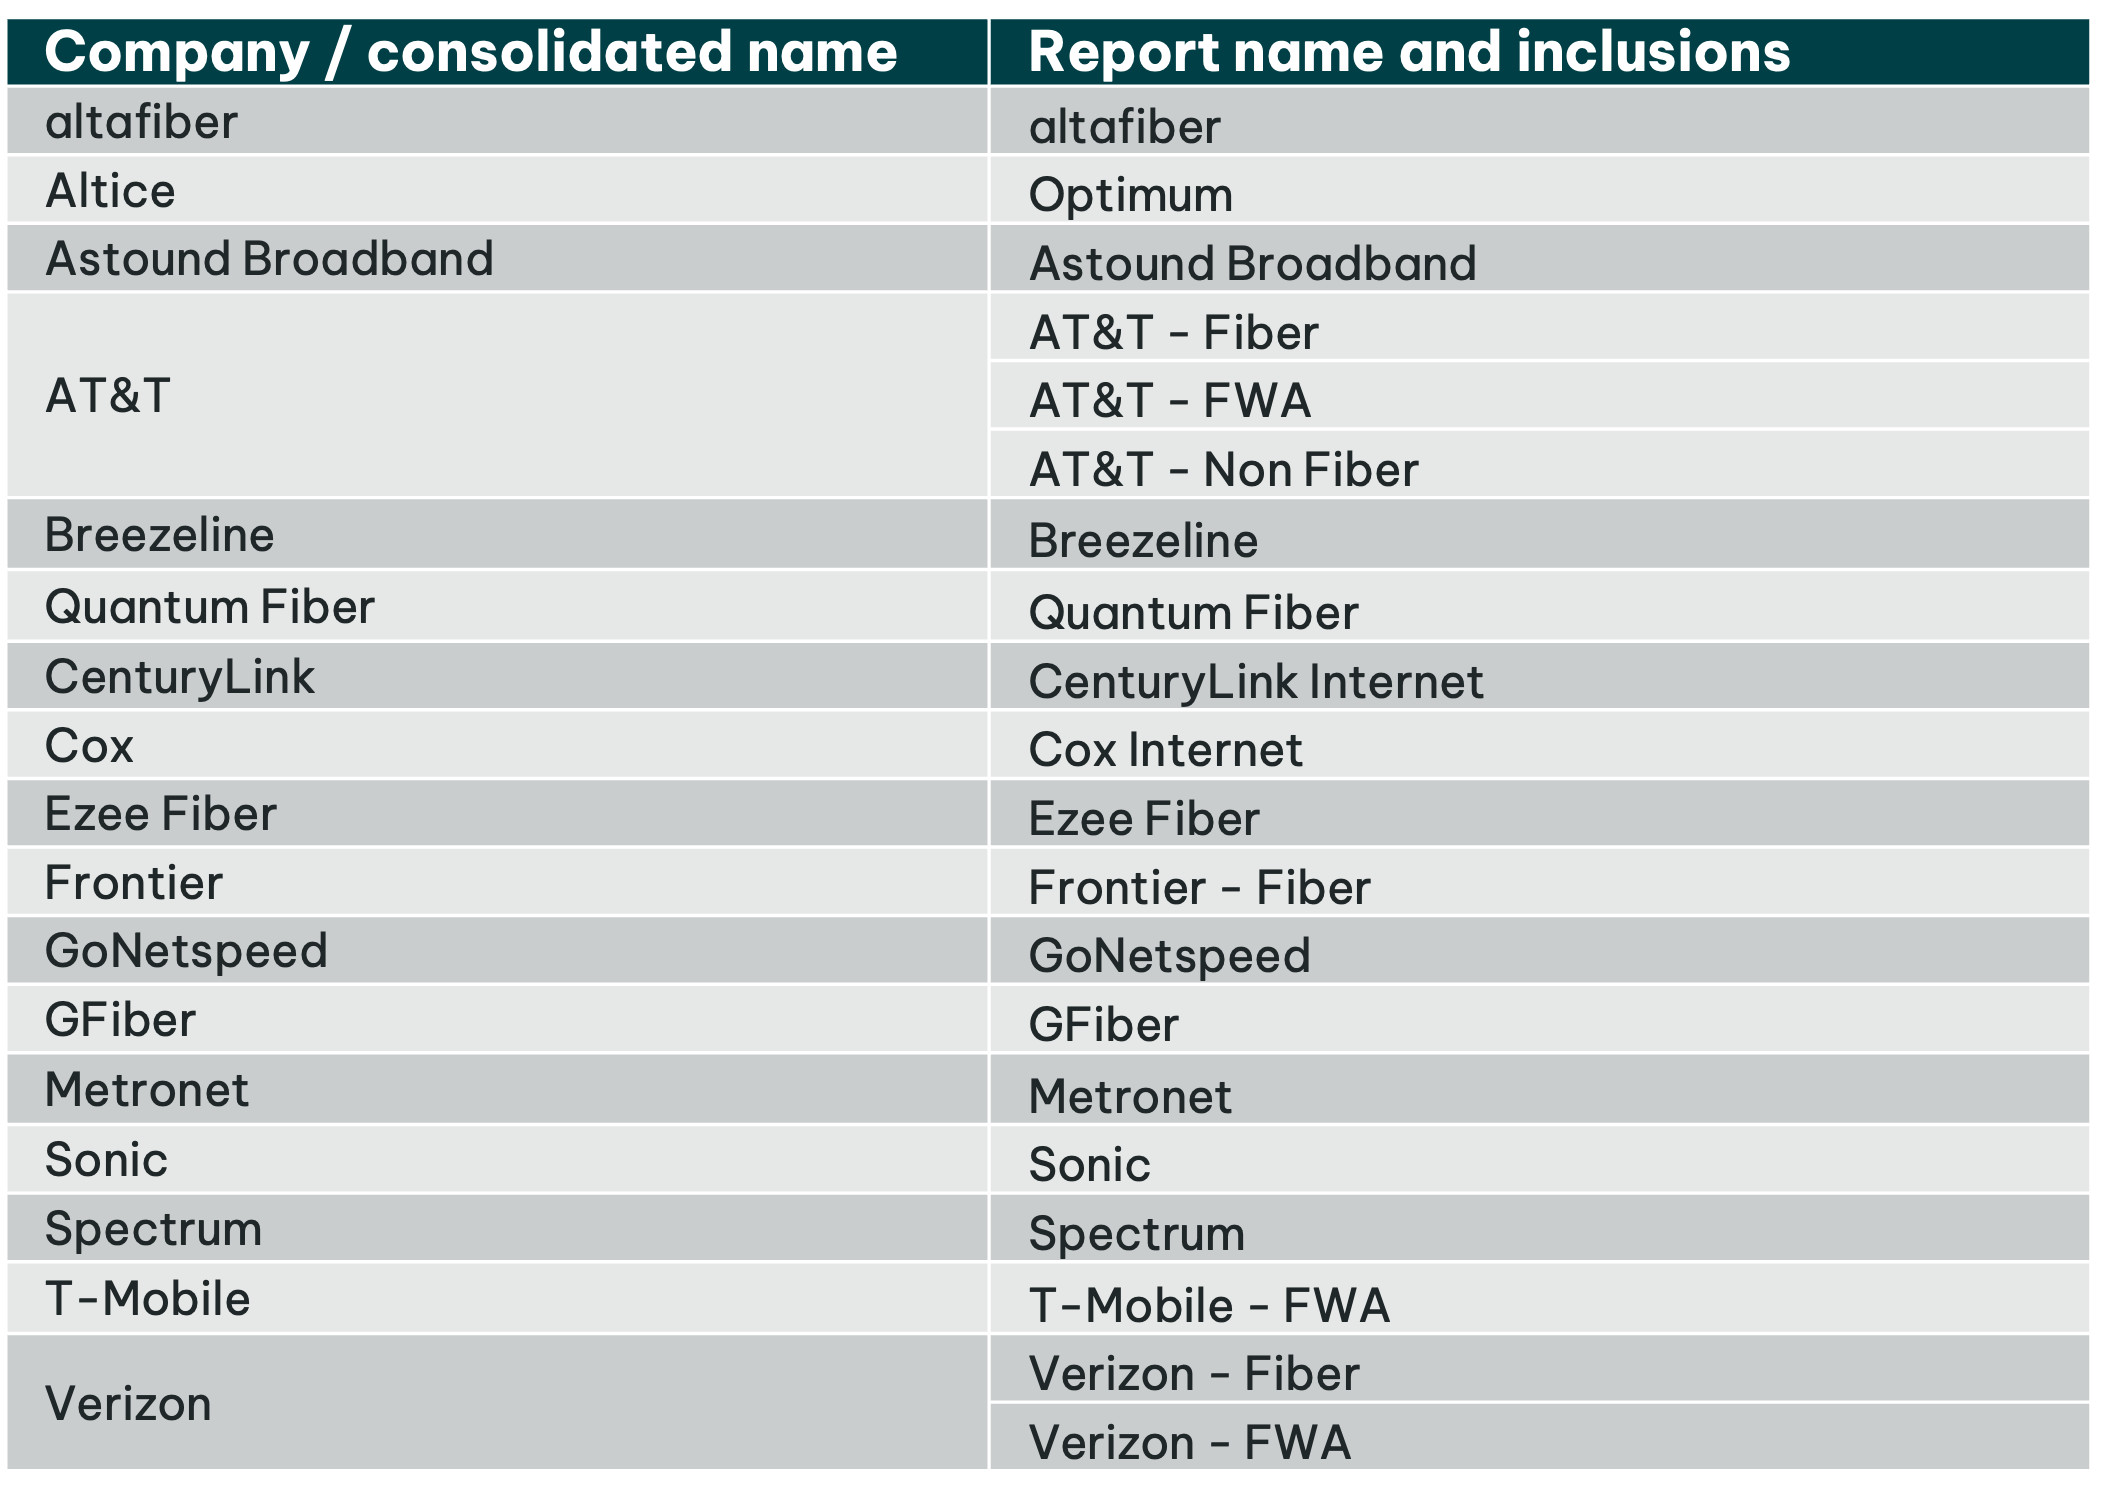
We have included a table below that outlines the parent companies associated with the consumer-facing broadband provider names, along with the included technologies in cases where an operator offers multiple access technologies.
Related Analysis
Our Methodology
Collecting billions of individual measurements daily from over 100 million devices globally, Opensignal independently analyzes mobile and broadband user experience on every major network operator around the globe.
About Opensignal
Opensignal is the leading global provider of independent insights into consumers' connectivity experiences and choice of carrier. Our proprietary insights into mobile and broadband networks give operators the solutions they need to profitably compete and win, from executive level scorecards and public validation to pin-point level engineering analytics and consumer decision dynamics.
Check how your internet connection impacts your favorite apps with the Meteor App



Journalists, please retain the Opensignal logo and copyright
(© Opensignal Limited) information when using this image.
This image may not be used for any commercial purpose, including use in advertisements or other promotional content, without prior written consent.
Confidence Intervals
For every metric we calculate statistical confidence intervals indicated on our graphs. When confidence intervals overlap, our measured results are too close to declare a winner. In those cases, we show a statistical draw. For this reason, some metrics have multiple operator winners.
In our bar graphs we represent confidence intervals as boundaries on either sides of graph bars.
In our supporting-metric charts we show confidence intervals as +/- numerical values.
Why confidence intervals are vital in analyzing mobile network experience