Authored by Sylwia Kechiche, Data support by Arith Hewathenna
As MWC 2026 approaches, 5G Standalone (SA) is no longer a trial technology. It is live in dozens of markets, devices support it, and operators have invested heavily in the transition. With the industry now halfway through the 5G investment cycle, the focus is shifting from building networks to proving their value.
The key question is no longer who has launched 5G SA. It is whether it is improving customer experience in a meaningful way — and whether those improvements are driving revenue.
Using Opensignal’s real-world data, this report assesses whether SA delivers better speed, lower delay and more reliable performance than non-standalone 5G.
Our findings are clear: results vary significantly by market. Where operators combine strong spectrum assets with dense network deployment, SA delivers clear gains in responsiveness and reliability. In other markets, the performance difference is marginal — showing that simply switching on standalone architecture does not automatically improve the customer experience.
Key Findings:
- SA is scaling, but unevenly. Launches and device availability are no longer constraints. However, user detection data shows that only a limited number of markets have deeply integrated SA into their mainstream network footprint.
- Performance gains are conditional. Download and latency improvements are measurable in spectrum-rich, densely deployed markets. Where radio fundamentals are weaker, SA delivers more limited incremental benefits. Consistent Quality improvements are not universal.
- Monetisation is emerging but concentrated. Fixed Wireless Access (FWA) is the clearest scalable revenue model. Slicing and enterprise deployments show promise but remain limited in overall subscriber impact.
Table of Contents:
The ecosystem is getting ready
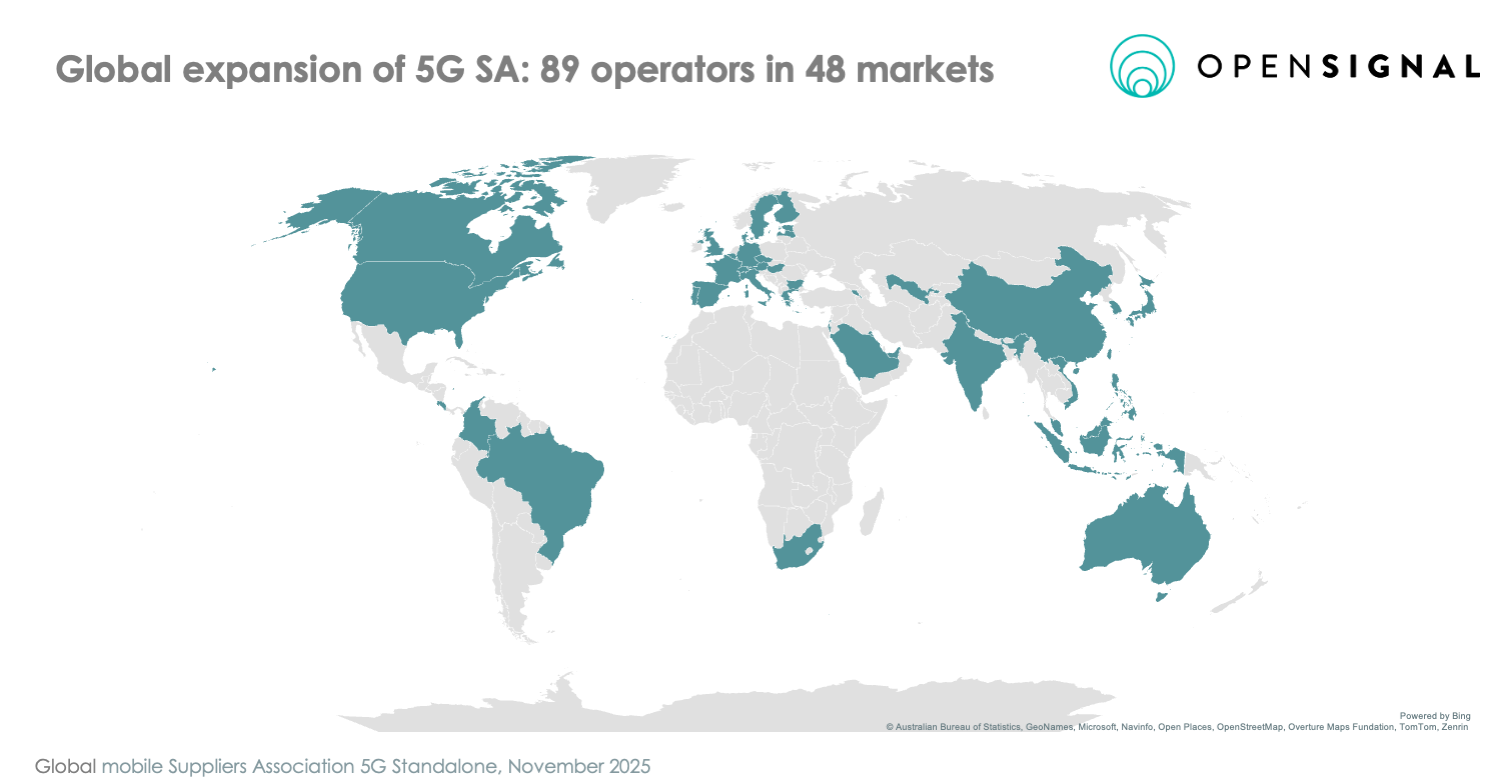
According to Global mobile Suppliers Association’s (GSA) 5G StandAlone Report, as of November 2025:
- 89 operators in 48 markets have commercially launched public SA networks
- 181 operators in 73 countries are investing in SA (via trials, planning or deployment)
- Over 2,750 announced devices support SA
SA is no longer confined to early adopters.
Around a quarter of operators with commercial 5G have progressed to Standalone deployment. Nearly 30% of operators investing in 5G are also investing in SA architecture. For context, roughly one third of mobile operators globally now offer commercial 5G services.
The device ecosystem has matured alongside network deployment. GSA reports over 2,750 announced SA-capable devices — a 30% year-on-year increase. Early constraints related to chipset availability and handset support have largely been resolved, removing one of the key structural barriers that slowed initial SA adoption.
From an ecosystem perspective, SA is no longer experimental. The relevant question is how deeply it is embedded within live networks — and what measurable impact it is delivering.
5G SA Coverage: Scaling is uneven
Commercial launch announcements indicate intent. But they do not necessarily show how deeply 5G SA is embedded within the active 5G footprint.
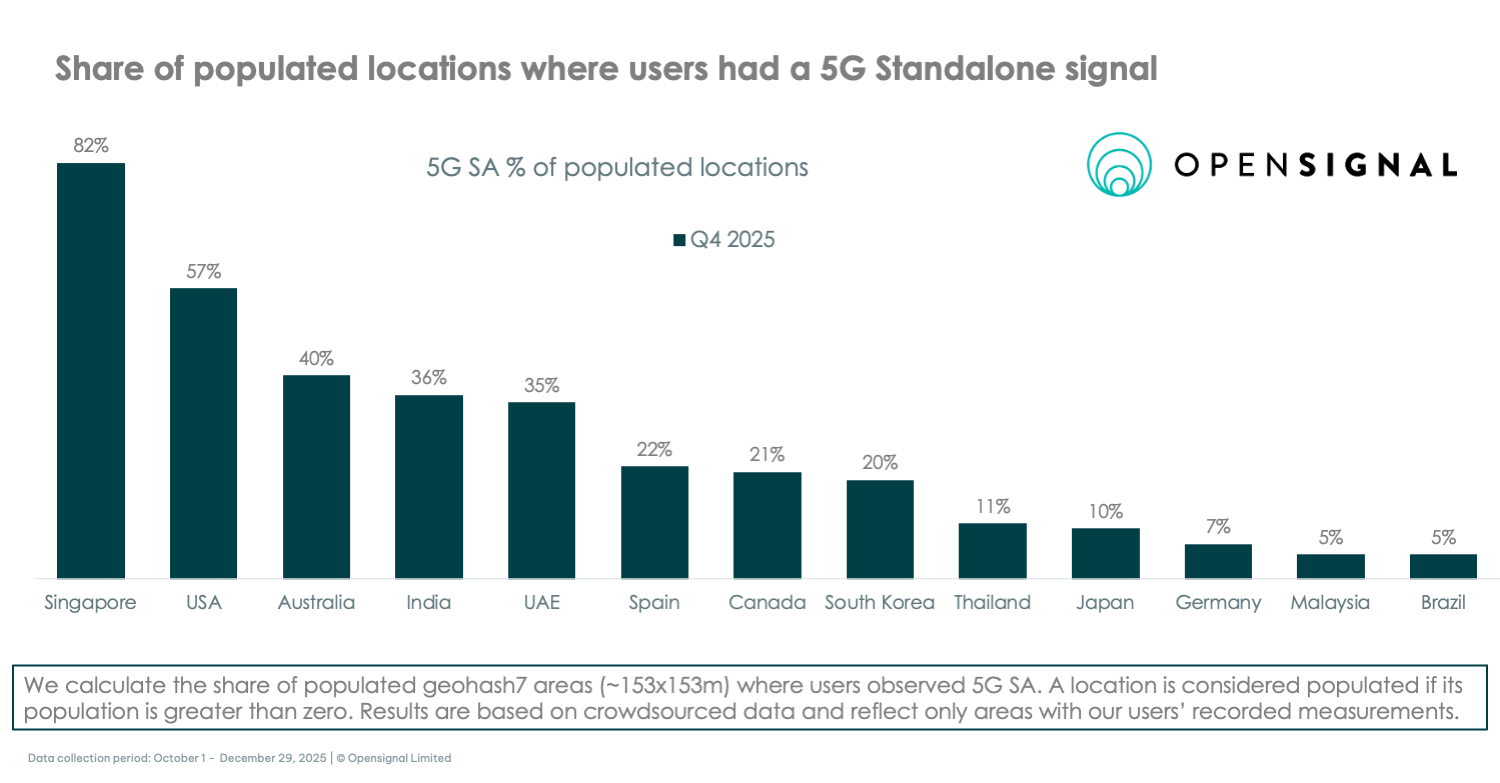
To assess scaling more realistically, we examine the share of populated locations where users detect persistent 5G SA signals. This user-based measure provides insight into where standalone architecture is actually accessible in day-to-day use, rather than where it is theoretically available.
The results show significant variation across markets. While 5G SA is operational in dozens of countries, in most markets the share of populated locations with observed 5G SA remains below the urban population share, indicating that deployment is still concentrated rather than broadly distributed.
North America: Broad Integration
The United States remains at the forefront of large-market SA scaling. By the end of 2025, 5G SA signals were detected in 57% of populated locations. This level of integration suggests that SA is no longer confined to urban hotspots but is increasingly embedded within the broader 5G footprint. T-Mobile US, an early adopter that launched SA in 2020, continues to hold a substantial lead in 5G Availability and Coverage Experience in our latest USA Mobile Network Experience report, though competitors Verizon and AT&T have narrowed the gap following their nationwide SA core launches and the deployment of C-band spectrum.
Canada has also progressed steadily, with SA detection rising from 9% in Q1 2024 to 21% in Q4 2025, reflecting continued standalone core investment.
Australia: Steady Expansion
Our data shows that Australia’s SA footprint expanded from 20% detection in Q1 2024 to 40% in Q4 2025. In a geographically dispersed market, this suggests that standalone architecture is extending beyond major cities, often aligned with FWA strategies.
India: Rapid Architectural Migration
India represents one of the fastest SA scaling cases globally. By late 2025, SA signals were detected in 36% of populated locations.
Reliance Jio’s predominantly standalone rollout accelerated architectural integration. However, rapid migration has also introduced congestion pressures as traffic volumes shifted quickly onto the new core.
UAE: Strategic Integration
The UAE reflects a strategy-led approach. oth e& (Etisalat) and du have commercially deployed 5G SA as part of broader service differentiation to support smart city, IoT and industrial use cases. Access to these networks is primarily managed through flagship device certification and premium plan tiers, such as e&'s "Freedom" or du's "Power" plans, rather than being a default upgrade for all users. Both operators use SA as a foundation for 5G-Advanced services, featuring Voice over New Radio (VoNR) for clearer calls and network slicing for industrial applications.
Europe: Gradual but Advancing
European markets show a more measured trajectory. Broader rollout patterns reflect more fragmented regulatory environments and differing spectrum auction timelines compared to North America and parts of Asia. Still, momentum is building:
Spain leads at 22% SA detection, ahead of Germany at 7%.
The Spanish government’s "Digital Spain 2026" agenda has successfully prioritized high-speed connectivity, allocating significant public funds to ensure ubiquity, especially in rural areas. Telefónica (Movistar) covers over 94% of the population across 5,700 municipalities with its “5G+” SA network, using 700 MHz and 3.5 GHz spectrum to balance coverage and capacity. Following the Orange-MásMóvil merger, MasOrange has moved into 5G-Advanced territory, activating capabilities such as VoNR and early network slicing use cases across dozens of cities. Vodafone Spain, under Zegona, has deployed a standalone 5G core with Ericsson and is extending coverage nationwide, including rural areas through the UNICO 5G program.
Germany’s three national MNOs now have live 5G SA offers — with Telekom Deutschland announcing nationwide 5G SA coverage in July 2025, alongside Vodafone’s nationwide 5G SA activation and O2 Telefónica’s “5G Plus” service.
In the U.K., 5G SA is also moving beyond pilots: EE has been expanding 5G SA across dozens of towns and cities, Vodafone markets its SA service as “5G Ultra,” and Virgin Media O2 has begun switching on 5G SA (starting with Manchester). In France all four national operators (Orange, Free, Bouygues Telecom, and SFR) now publicly claim consumer-facing 5G SA/“5G+” availability, with SFR’s consumer launch announced in October 2025.
APAC: a tale of two strategies
Singapore stands out globally, with SA detection reaching 79%. As a city-state with coordinated regulatory oversight, Singapore positioned standalone architecture as the default from an early stage of 5G rollout.
Japan and South Korea are advanced 5G markets that have taken a cautious approach to SA migration, prioritizing nationwide NSA stability before transitioning the core.
Japan presents a contrasting case. Despite being an advanced 5G market, SA detection remains around 10%, reflecting a phased migration strategy that prioritised nationwide NSA stability before accelerating standalone integration. All four major Japanese mobile operators — KDDI (au), SoftBank, NTT Docomo, and Rakuten Mobile — have launched or are deploying 5G SA capabilities, with varying degrees of commercial rollout and coverage. Device support is now widespread among newer flagship and mid-range models, but compatibility depends on both hardware/software support and operator certification. Operators typically require 5G SA-compatible plans and SIM/eSIM profiles, and in some cases users must migrate to current 5G tariffs or update their SIM to activate SA. Some operators bundle SA access within standard plans (e.g., Rakuten Mobile), while others treat it as an optional service layer on top of 5G plans.
South Korea, long viewed as a 5G frontrunner, shows SA detection at approximately 20%. KT currently remains the only operator with a fully operational nationwide standalone core. To accelerate the transition, the South Korean government has intervened directly. All 5G base stations must be connected to standalone core equipment by 2026. Regulators are reinforcing this mandate with financial incentives — offering a 15% reduction in LTE spectrum reallocation fees to operators that deploy more than 20,000 indoor 5G base stations.
Elsewhere in Southeast Asia, integration is progressing more gradually:
- Thailand has reached 11% SA detection,
- Malaysia sits at 5%.
In Thailand, AIS remains the only operator to have commercially deployed 5G SA services, as it develops private 5G SA networks partnerships with vertical industries. Meanwhile, in Malaysia, 5G SA is offered by two operators: U Mobile and Yes, although other Malaysian MNOs are trialling these services. These two carriers employ distinct rollout strategies. Yes provides 5G SA via the nationwide Single Wholesale Network (SWN) operated by the state-owned Digital Nasional Berhad (DNB). Meanwhile U Mobile is pursuing a dual strategy at the moment: it continues to leverage DNB’s infrastructure while simultaneously having launched its own 5G SA network as part of Malaysia’s transition to a dual-network model.
In both Thailand and Malaysia, 5G SA figures remain low because many users are still on older devices and SIM cards that aren’t compatible with 5G SA. On top of that, there is a 'value gap': most consumers aren't yet aware of what 5G SA actually offers, or they don't feel the performance boost is worth the effort and cost of upgrading. Malaysia’s lower figure may also reflect the complexities of its transition from a SWN model to a dual-network structure. While 5G availability in Malaysia is high due to the initial rapid rollout by DNB, the transition to a standalone environment for individual operators is still in its early stages.
Brazil: policy-driven acceleration
Brazil has emerged as the frontrunner for 5G SA in Latin America, driven by the government's 2021 spectrum auction which implemented clear coverage obligations linked to the standalone core. As of Q2 2025, Anatel (the Brazilian regulator) reports that 5G deployments are ahead of schedule with 5G coverage reaching nearly 64% of the country – representing the proportion of the population living in municipalities with 5G ahead of 2027 targets. However, high population coverage does not automatically equate to consumer adoption. To access 5G SA, often marketed in Brazil as "5G Puro" (Pure 5G), consumers need to be in possession of a 5G SA certified by Anatel, and requires a specific setup from MNOs.
5G SA Performance Reality: Gains — but results vary
Architectural rollout is accelerating. However, the real test of SA is not coverage — it is performance.
SA introduces a cloud-native core and removes 4G anchoring, creating the potential for lower latency, improved stability and service differentiation. In practice, real-world outcomes depend heavily on spectrum depth, deployment density, core placement and transport optimisation.
While download speeds are often used as a headline metric, the true value of SA is found in latency reduction, uplink stability, and Consistent Quality (CQ).
Opensignal’s data shows that results vary considerably by market.
Download Gains Where Spectrum Is Strong
In markets with deep mid-band spectrum holdings and dense deployment, 5G SA amplifies performance.
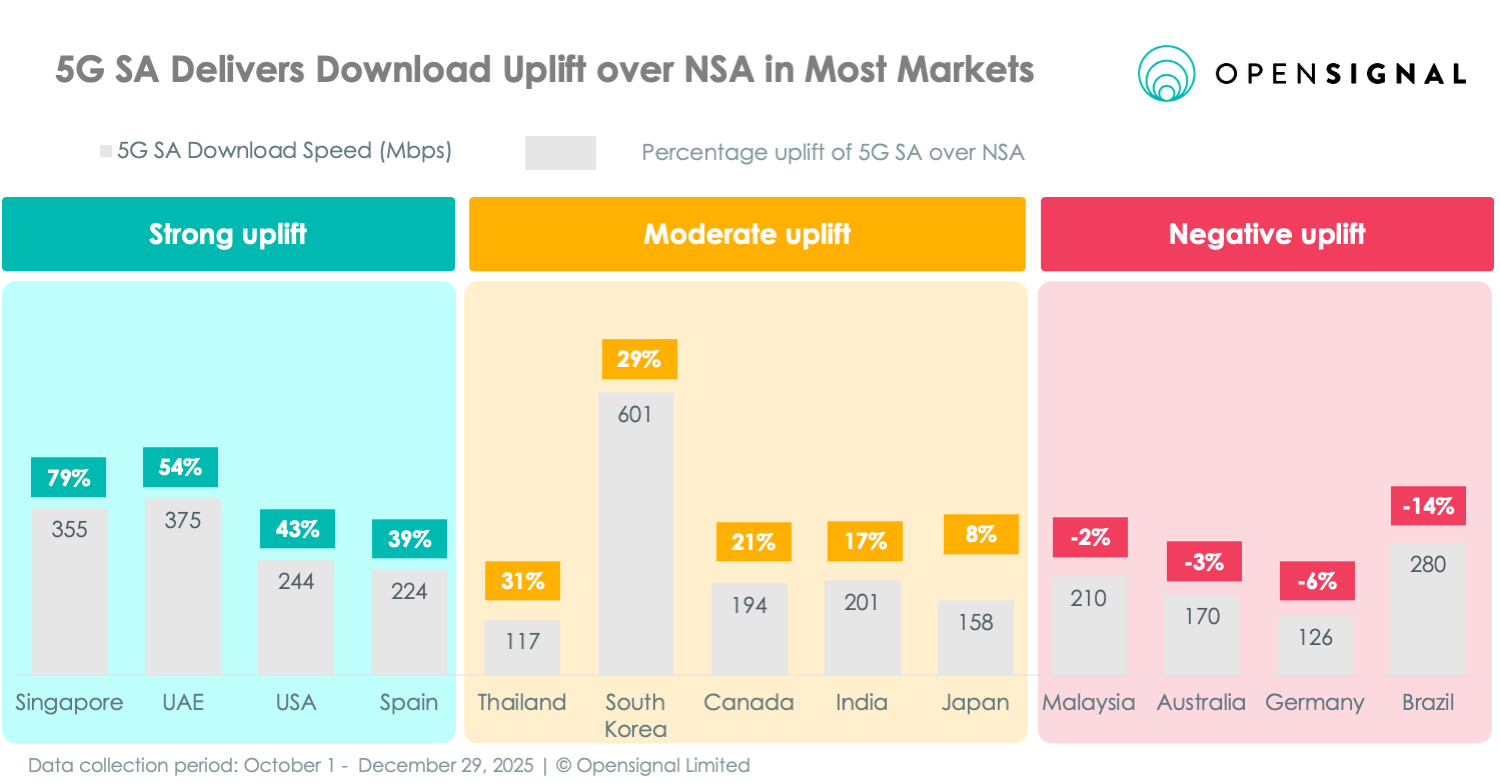
We see a strong uplift across Singapore, the UAE, the USA and Spain.
Singapore illustrates a disciplined, centrally coordinated approach. Under the oversight of IMDA, the telecom regulator, SA was positioned early as the foundation of the country’s Smart Nation strategy. With strong spectrum depth and high cellsite density, standalone deployment was integrated into performance objectives from the outset rather than layered onto an existing NSA footprint. The UAE shows a similar pattern: strong spectrum assets, coordinated rollout and a deliberate transition toward standalone core infrastructure.
A second group of markets shows moderate but still meaningful improvement — Thailand, South Korea, Canada, India and Japan.
South Korea is a particularly interesting example. Absolute download speeds on SA exceed 600 Mbps, yet uplift versus NSA is “only” +29%. This reflects a mature and highly optimised NSA baseline. South Korea also combines substantial mid-band spectrum, dense site deployment and strong backhaul. Regulatory policy is now reinforcing this architectural shift: the government has mandated that 5G base stations be connected to standalone core equipment by 2026, aligning network evolution with national AI and 6G ambitions. T
The final cluster includes Malaysia, Australia, Germany and Brazil — markets where SA does not deliver download uplift, and in fact it shows a decline.
This is analytically important.
It demonstrates that SA architecture alone does not guarantee higher download speeds. In these environments, NSA layers may remain equally or better optimised. Transport routing, spectrum allocation strategies or load distribution across layers can result in NSA performing as well as — or better than — standalone.
Across all clusters, a consistent pattern emerges:
Where spectrum depth and densification are strong, SA delivers measurable improvements in both download speeds and latency. Where radio fundamentals are weaker or more constrained, performance differences between SA and NSA narrow considerably.
SA enhances performance — but it does not compensate for spectrum or cell site density limitations.
The Latency Promise: partially realized
One of the core architectural promises of 5G Standalone is lower latency. By introducing a cloud-native core and removing 4G signalling dependencies, SA reduces the number of network hops required to complete a data transaction.
Latency refers to the time it takes for data to travel from a user’s device to the network and back again. Lower latency improves responsiveness — reducing delays when loading interactive content, initiating video streams or engaging in cloud-based applications.
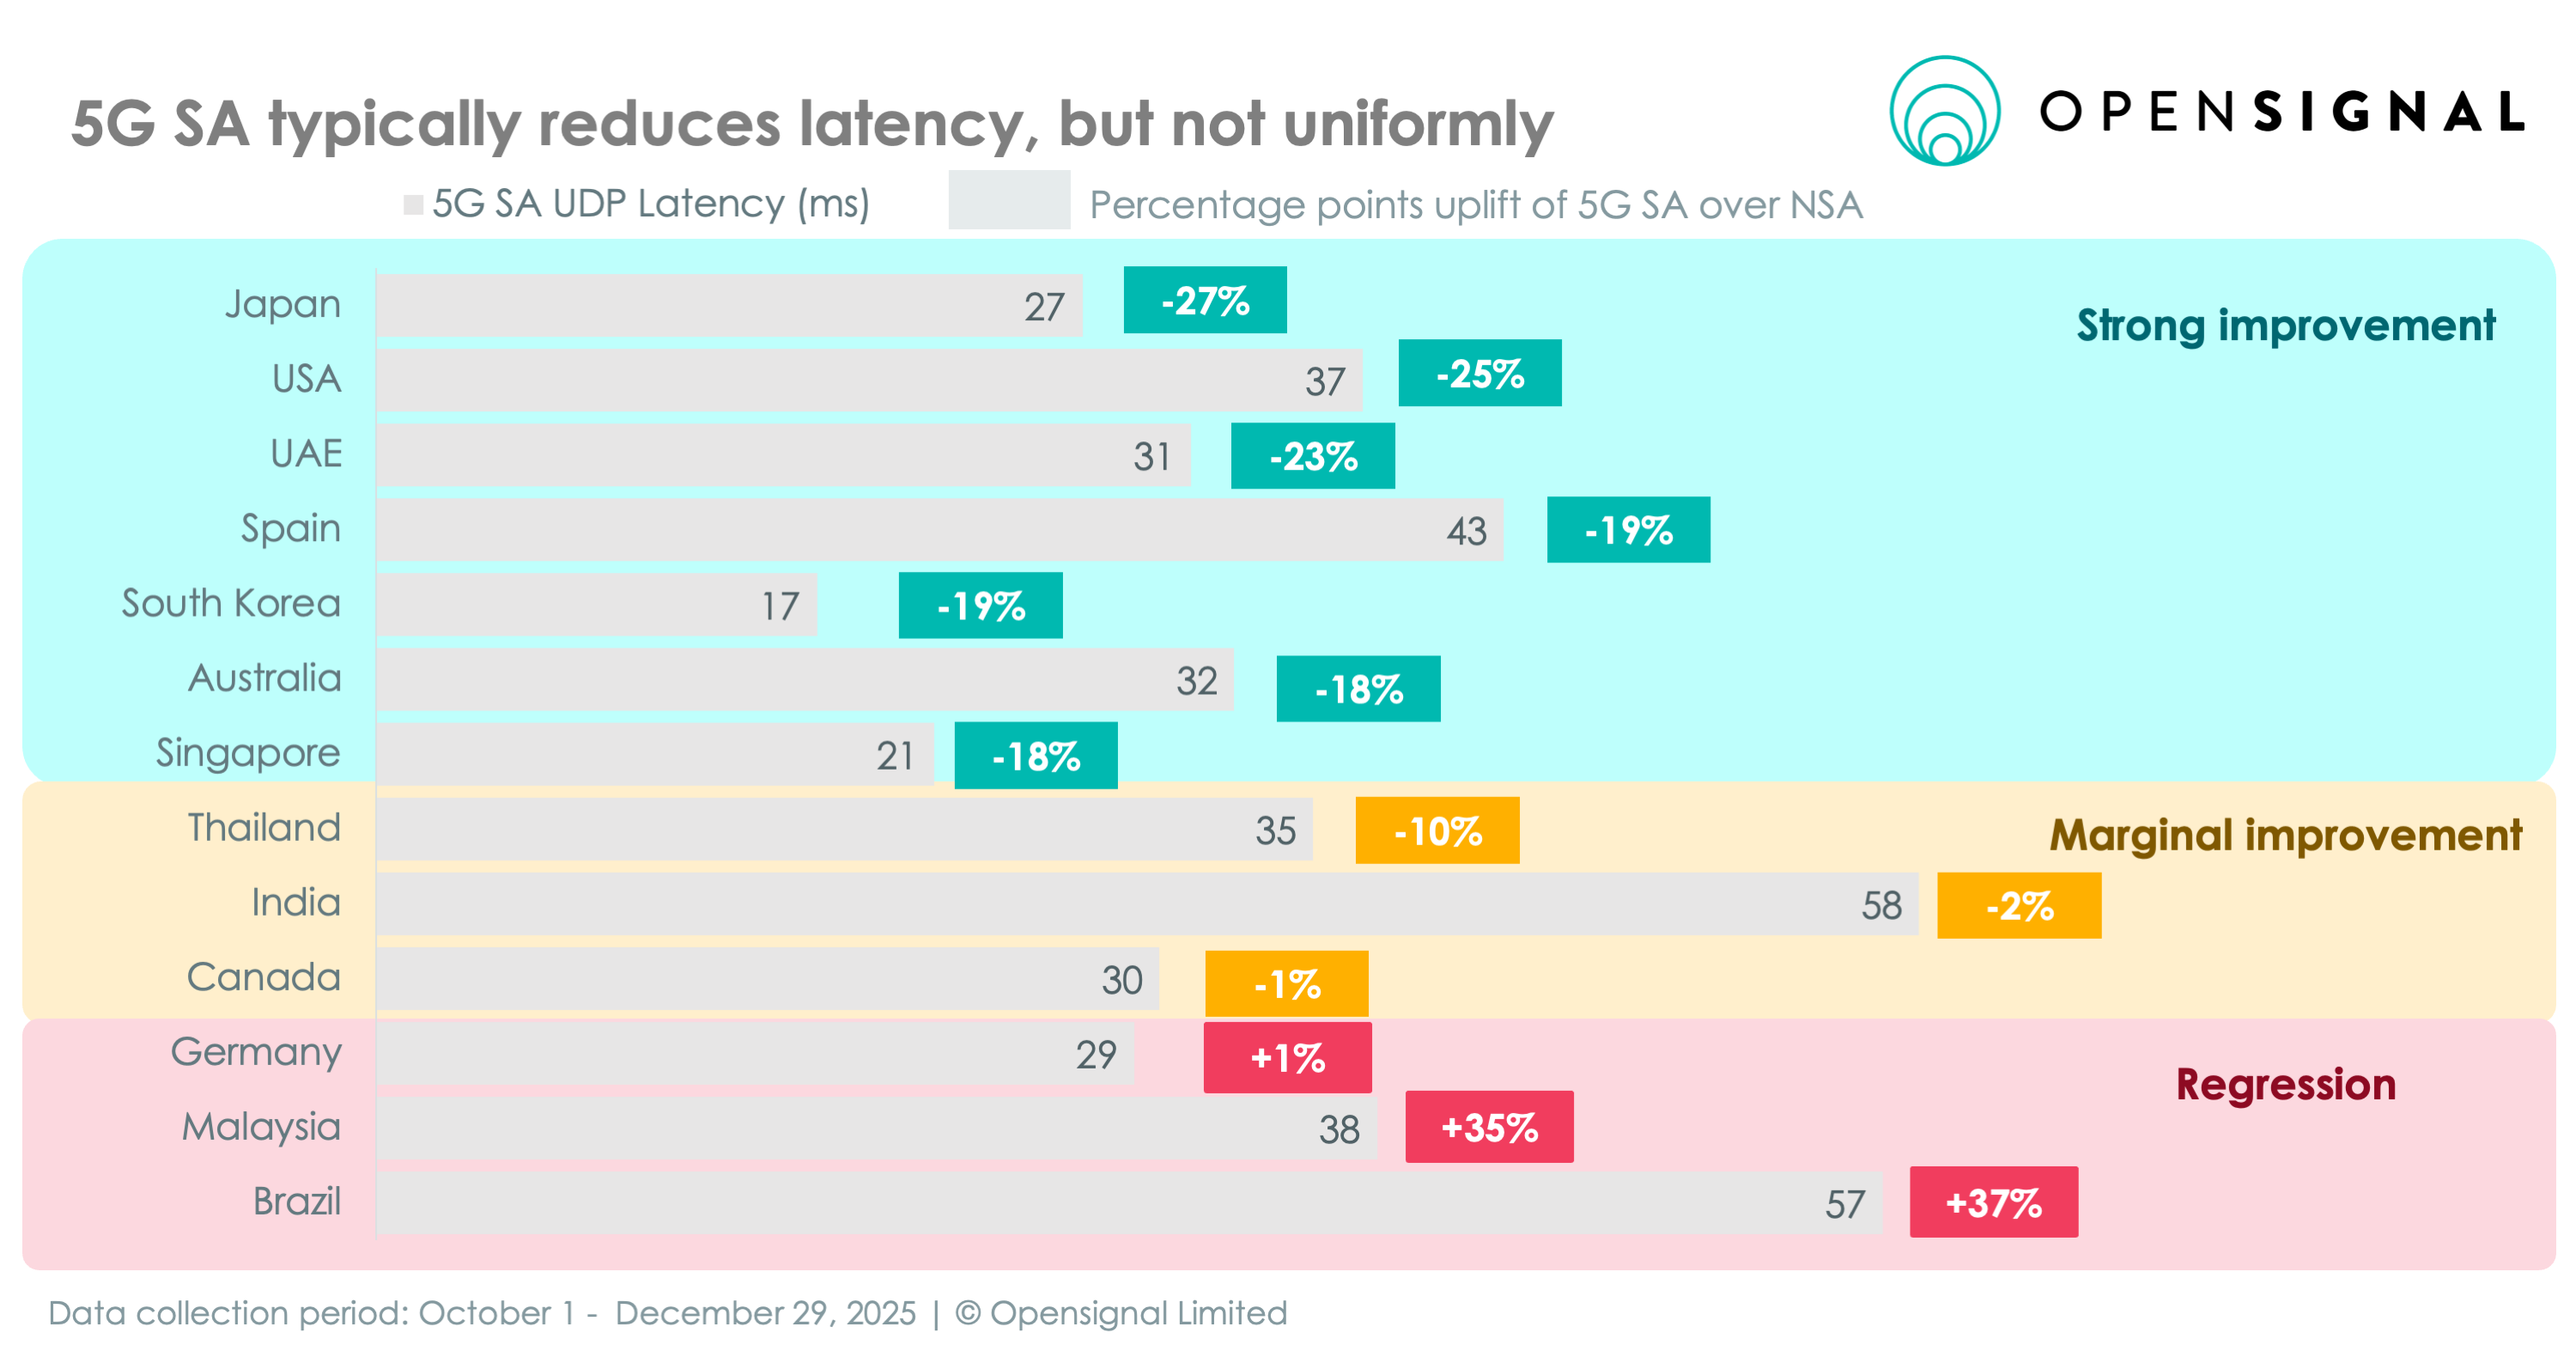
Our Q4 2025 data shows three clear latency clusters across markets.
Cluster 1: Strong Latency Improvement (≥18% Reduction)
Japan (-27%), United States (-25%), United Arab Emirates (-23%), Spain (-19%), South Korea (-19%), Australia (-18%) and Singapore (-18%) all recorded double-digit latency reductions on SA compared to NSA.
- Japan recorded a 27% reduction in 5G UDP latency on SA networks. In practical terms, this translates into shorter initial buffering times when starting video streams and more responsive cloud gaming experiences on networks such as au and SoftBank.
- In the United States users saw a 25% reduction, reflecting both standalone core maturity and optimised edge deployment.
- South Korea, Singapore, Australia and Spain recorded double-digit reductions ranging between 18% and 19%, strengthening performance for real-time applications including gaming and video conferencing.
Cluster 2: Marginal Latency Improvement (0 – 10% Reduction)
Thailand (-10%), India (-2%) and Canada (-1%) show only modest or limited latency improvements. In these markets, SA is present but not yet materially improving responsiveness. This may reflect ongoing core scaling, load pressures during rapid migration or evolving edge placement.
However, latency improvements are not universal.
Cluster 3: Latency Regression
In Malaysia, 5G UDP latency increased by 35%, and in Brazil, even further (by 47%). These outcomes suggest that standalone migration alone does not guarantee lower latency. Core placement, backhaul optimisation, traffic management and load balancing all influence real-world results. In some cases, rapid migration of traffic to the SA core may temporarily strain routing efficiency before full optimisation is achieved.
The data reinforces a broader pattern: SA provides the architectural foundation for lower latency, but measurable gains depend on how effectively the network is architected and scaled.
Consistent Quality: The Metric for Monetization
If operators aim to monetise 5G through service differentiation — such as guaranteed performance for gaming, enterprise applications or network slices — consistency matters more than peak speed.
Opensignal’s Consistent Quality (CQ) metric measures the proportion of tests that meet the performance thresholds required for demanding mobile applications, including HD video streaming, video calls and multiplayer gaming. It reflects how often a network delivers an experience that is “good enough” for real-world use — not just how fast it can go under ideal conditions.
Across most markets analysed, 5G SA delivers either equal or higher Consistent Quality compared to NSA. However, the magnitude of improvement varies across markets.
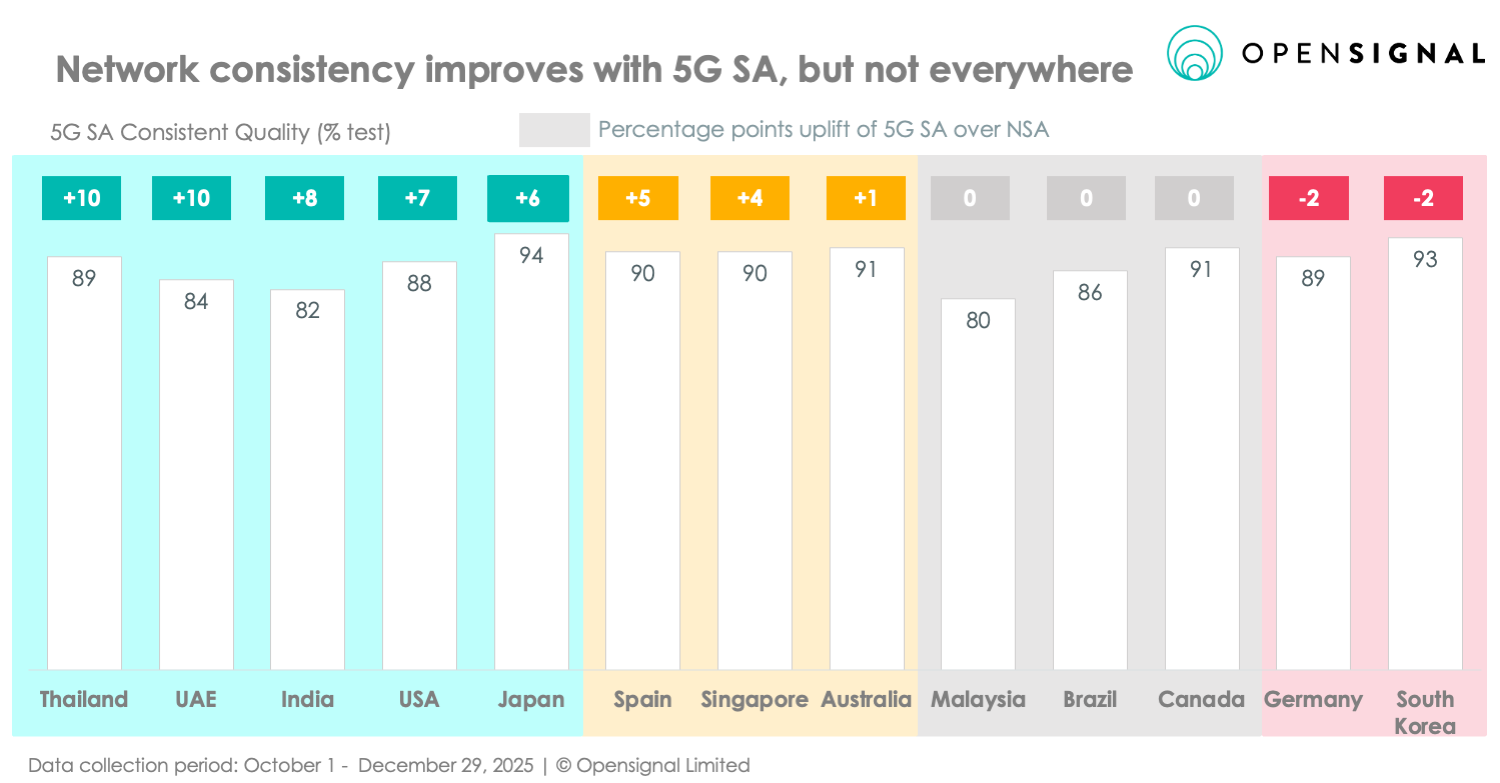
1. Markets with strong uplift : A first group of markets shows clear and commercially meaningful CQ uplift on SA:
- Thailand (+10 percentage points)
- United Arab Emirates (+10pp)
- India (+8pp)
- United States (+7pp)
- Japan: +6pp (94% vs 88%)
In these markets, SA materially increases the share of time users receive application-grade performance. For example, in India, CQ rises to 82% on SA versus 74% on NSA.
2. Incremental gains : The second cluster includes markets where CQ was already high on NSA and improves moderately on SA:
- Spain (+5pp, reaching 90%)
- Singapore (+4pp, reaching 90%)
- Australia (+1pp, reaching 91%)
These are mature 5G markets with strong spectrum positions and dense deployment.
3. Flat impact : A third group shows no CQ change
- Malaysia (0pp)
- Brazil (0pp)
- Canada (0pp)
In these markets, SA deployment has not yet translated into measurable improvements in consistency. Apart from Canada, Malaysia and Brazil are the markets where SA scaling is still underway,
4. Negative impact: Only two markets show a slight CQ decline on SA:
- Germany (-2pp)
- South Korea (-2pp)
Importantly, both markets had relatively high 5G NSA baselines (South Korea at 95%, Germany at 90%).
Early Monetization: What is actually working?
The performance analysis shows that SA can deliver measurable improvements in speed, latency and, in many markets, stronger consistency. The commercial question is whether those technical gains are translating into revenue.
So far, monetisation remains concentrated in specific use cases rather than broadly distributed across consumer bases.
1. Fixed Wireless Access (FWA): the Low-Hanging Fruit
As we have reported before, FWA is currently the clearest scalable SA use case. During pre-MWC Analyst event Ericsson shared how operators such as Odido, Elisa and Cosmote have used SA capacity and slicing to:
FWA converts network capacity into revenue with relatively low commercial complexity.
2. Network Slicing: Early but Expanding
Globally, 65 commercial offerings now use 5G SA slicing.
Network slicing allows operators to partition their infrastructure to provide guaranteed Quality of Service (QoS) for specific applications. Singapore’s Singtel’s gaming optimisation strategy and T-Mobile’s “T-Priority” or Verizon’s “Frontline” services demonstrate that milliseconds can be monetised. But slicing remains early-stage relative to total subscriber base.
3. Enterprise and Public Safety
Enterprise deployments demonstrate SA’s operational potential, particularly in public safety and healthcare. These use cases are strategically significant but remain narrower in scale compared to consumer markets.
The 2026 inflection point?
5G Standalone is no longer experimental.
The ecosystem is maturing, coverage is expanding and in several markets, latency and consistency gains are measurable.
At the same time, improvements are uneven. In mature NSA markets, SA often functions as structural modernisation rather than an immediate consumer step-change. Monetisation is progressing — but remains concentrated in FWA.
The data suggests that architectural deployment is only the first stage. The next phase of 5G differentiation will depend on optimisation, automation and the ability to translate measurable performance improvements into durable commercial models.
This is where 5G-Advanced (3GPP- Release 18) enters the picture. In leading markets, operators are beginning to layer AI-driven optimisation, uplink enhancements, RedCap device strategies and more granular slicing on top of standalone cores. If SA established architectural independence from 4G, 5G-Advanced is designed to improve efficiency, performance stability and service precision — all prerequisites for scalable monetisation.
At the same time, early 6G discussions are accelerating across standards bodies and vendor roadmaps. But the commercial credibility of the next generation will depend heavily on how effectively operators extract value from 5G Standalone today. Networks that have not yet translated architectural change into measurable performance and revenue gains may face greater scrutiny in the next investment cycle.
As the industry approaches MWC 2026, the question is no longer whether SA has launched. It is whether it has been optimised — and whether it is paying back.
Opensignal will continue to measure where those differences are visible in real-world experience.
Meet Opensignal at MWC 2026
At MWC 2026, we will be sharing deeper analysis on:
- How SA performance differs across markets
- Where latency and consistency improvements are most material
- Which deployment strategies are translating into measurable outcomes
Our new whitepaper, in partnership with Mobile World Live (MWL), is now live: How Operators Can Drive Subscriber Growth in a Converged Market
The paper outlines how operators can differentiate, reduce churn and win high-value subscribers in a converged landscape — grounded in real-world user experience data across local markets.
If your focus at MWC 2026 is growth, retention or convergence strategy, we can show how measurable improvements in local network experience translate into competitive advantage.
To schedule a briefing with our team during MWC, contact Opensignal directly or request a meeting via our events page.
Opensignal Limited retains ownership of this insight including all intellectual property rights, data, content, graphs & analysis. Reports and insights produced by Opensignal Limited may not be quoted, reproduced, distributed, published for any commercial purpose (including use in advertisements or other promotional content) without prior written consent. Journalists are encouraged to quote information included in Opensignal reports and insights provided they include clear source attribution. For more information, contact [email protected].